
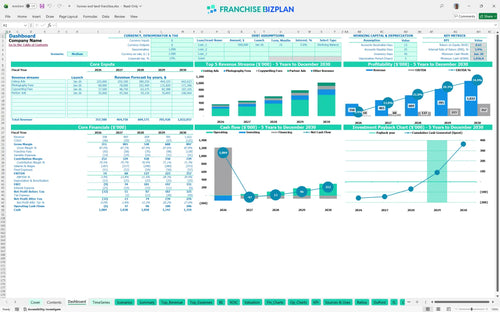
All-in-one Dashboard
Core inputs and core outputs


This franchise unit financial model template provides a complete Excel-based toolkit for forecasting revenue, managing expenses, and performing a deep franchise profitability analysis for your investment.
Core inputs and core outputs
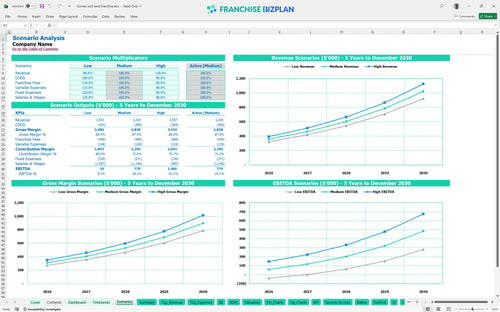
Three scenario analysis
Presentation ready
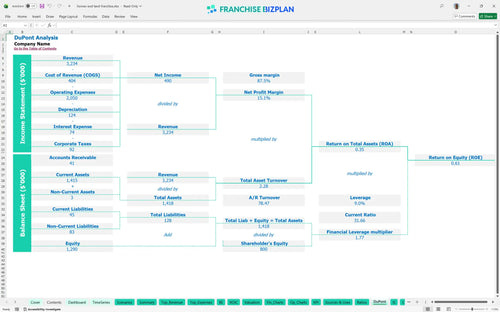
DuPont analysis
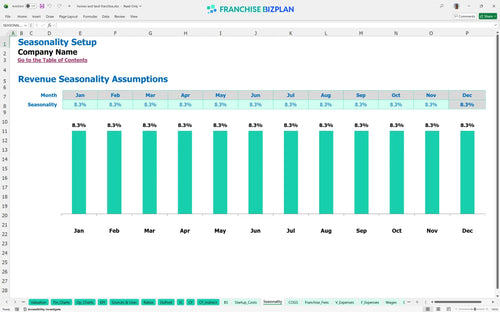
Researched revenue assumptions
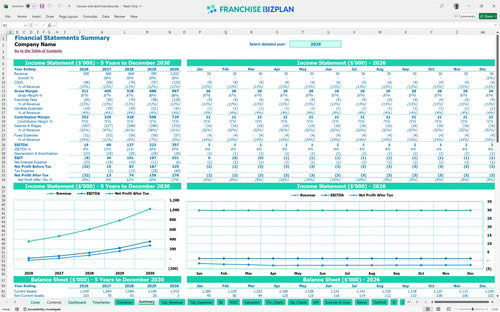
Lender-friendly financial outputs
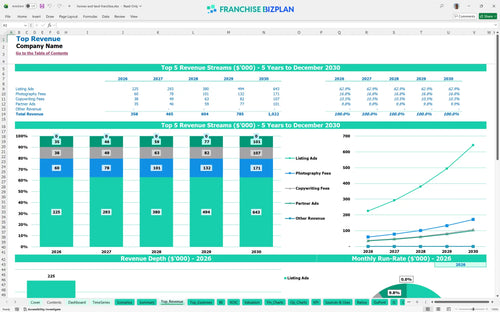
Revenue stream detailed view
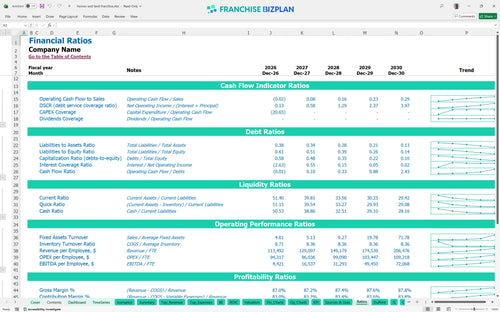
Performance metrics benchmark
We built this franchise unit financial model using our own research into the luxury real estate marketing space. Key assumptions like the $358,000 year-one revenue and 10.5% royalty fees are pre-populated but fully editable to match your local market. It is a practical tool designed to show you the real numbers behind the glossy pages and help with estimating revenue for a luxury real estate marketing business.
This unit is projected to hit EBITDA profitability in its first year, starting with $14,000. By year three, as revenue climbs toward $604,000, the net profit expands to $127,000 because fixed costs like the $2,500 monthly rent stay stable while sales grow. This franchise unit profit and loss statement template shows a clear path to $357,000 in EBITDA by year five.
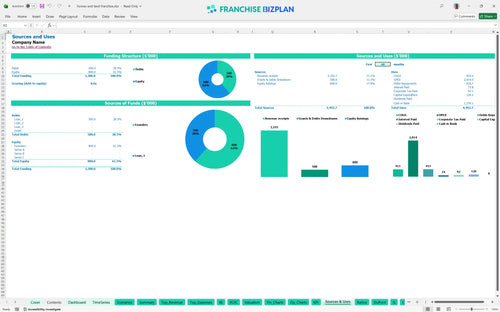
You will need to know how to calculate startup costs for a real estate franchise, which total approximately $126,200 for this unit. This includes the $27,000 franchise fee, $22,000 in office improvements, and $28,000 for a distribution vehicle. The startup budget template for service-based franchises ensures you account for every piece of equipment and initial marketing material.
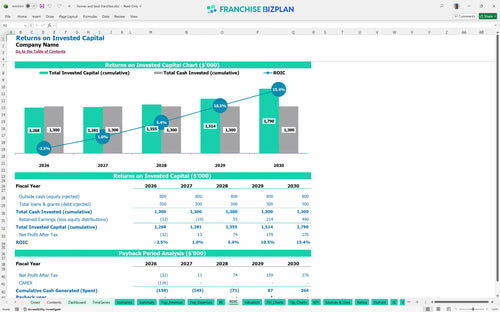
The model shows a 4-year payback period and an internal rate of return (IRR) of 3.89%. While the initial ROI calculation might seem conservative, the return on equity of 0.61 reflects a steady build-up as the unit matures into a $1 million revenue business. This financial planning guide for new franchise owners helps you visualize the long-term value of the equity you are building.
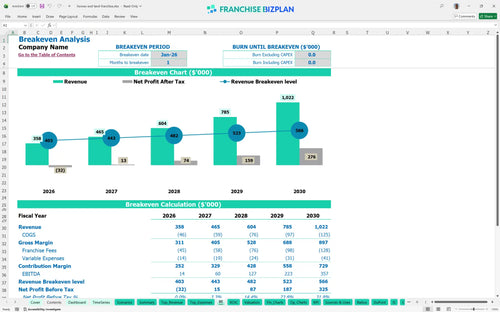
Break-even is achieved almost immediately in January 2026, provided you hit your initial sales targets. The primary driver for staying above water is your listing ad volume, which needs to cover about $4,250 in fixed monthly overhead plus your variable printing and royalty costs. A precise break-even analysis is the best way to manage your early-stage risk.
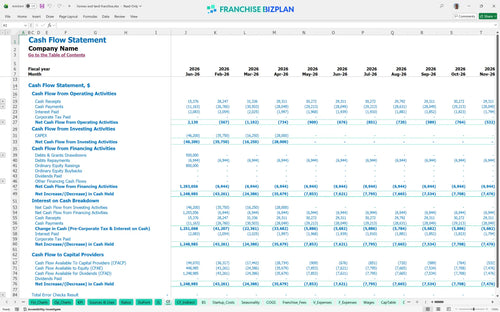
The lowest cash point is projected for January 2028 at $1,036,000, suggesting a very strong cash position if the ramp-up goes as planned. Still, you should keep a close eye on the timing of your $28,000 vehicle purchase and $14,500 equipment spend to avoid any short-term liquidity pinches. Analyzing operating expenses for a boutique real estate franchise requires constant monitoring of these capital expenditure forecasting items.
Moving from a medium to a high-growth scenario significantly boosts your year-one margin and accelerates your 4-year payback. If sales grow faster than the projected 30% annual rate, your EBITDA of $14,000 in year one could defintely double, as your fixed costs are already covered. Using an Excel template for franchise unit financial projections makes it easy to toggle these growth rates and see the impact.
This franchise unit financial model is fully customizable in Excel, allowing you to adjust every variable to your specific territory. We have pre-filled the formulas and editable assumptions so you can easily adapt the small business financial projection template to your local rent, labor rates, and market demand. It is defintely simpler to make decisions when you can see how a 5% shift in printing costs impacts your bottom line.

Mapping out long-term performance helps you see the transition from a startup to a mature luxury marketing operation. The model provides detailed 5-year revenue forecasts, showing growth from $358,000 in year one to over $1 million by year five. This comprehensive view ensures your real estate franchise business plan accounts for long-term profitability and sustainable cash flow as you scale your multi-channel engine.

Operating a brand requires managing specific financial obligations like a 10.5% royalty and a 2% marketing fund contribution. This model automates these calculations based on your projected sales, helping you follow best practices for forecasting franchise royalty payments. By tracking these ongoing costs against your $150,000 in initial listing ad revenue, you can maintain a clear view of your actual store-level margins.

Launching requires a clear budget for items like the $27,000 franchise fee and $28,000 for a distribution vehicle. This franchise startup cost template aggregates all initial capital needs and identifies the exact sales volume required to cover your fixed monthly costs. Knowing your break-even point helps you set realistic sales targets for your sales executive and content team from day one.

We have included built-in industry benchmarks so you can compare your projected 11% printing production costs against typical franchise standards. These markers act as a sanity check for your labor and occupancy assumptions, ensuring your financial model template for franchise unit operations stays grounded in reality. If your photography fees or rent costs drift from the norm, the model helps you spot the gap early.


Simply purchase and download the financial model template, then access it instantly using Microsoft Excel or Google Sheets. No installation or technical expertise required-just open and start working.

Enter your business-specific numbers, including revenue projections, costs, and investment details. The pre-built formulas will automatically calculate financial insights, saving you time and effort.

Leverage the investor-ready format to confidently showcase your financial projections to banks, franchise representatives, or investors. Impress stakeholders with clear, data-driven insights and professional reports.

Leverage the investor-ready format to confidently present your projections to banks, franchise representatives, or investors.