
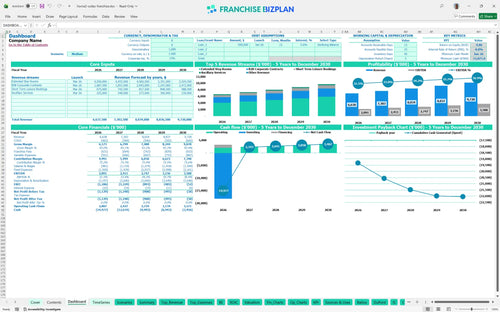
All-in-one Dashboard
Core inputs and core outputs


This product provides a complete set of pro forma financial statements for new hotel franchise units, including integrated income statements, balance sheets, and cash flow reports.
Core inputs and core outputs
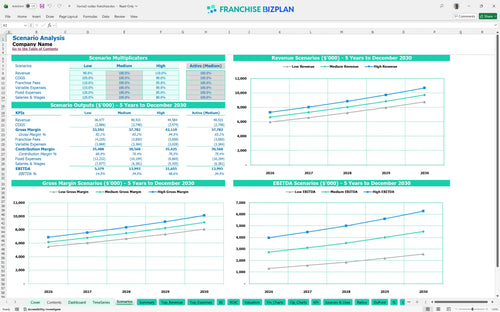
Three scenario analysis
Presentation ready
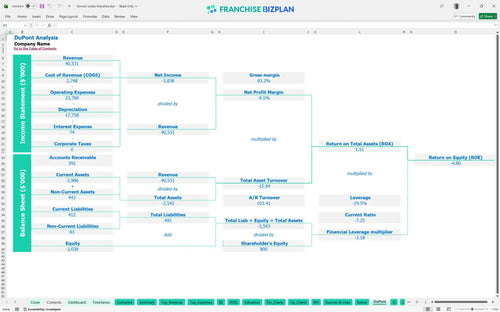
DuPont analysis
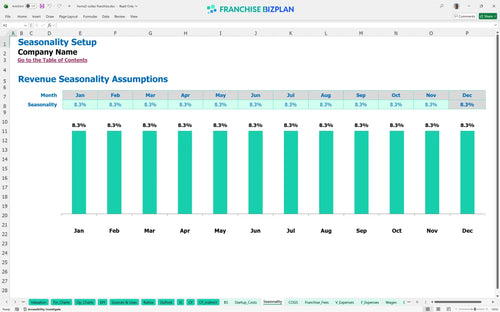
Researched revenue assumptions
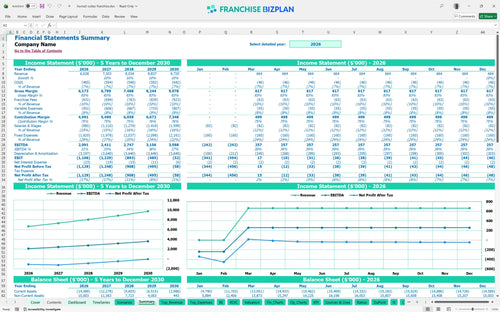
Lender-friendly financial outputs
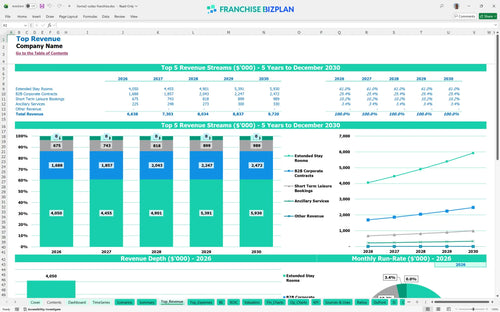
Revenue stream detailed view
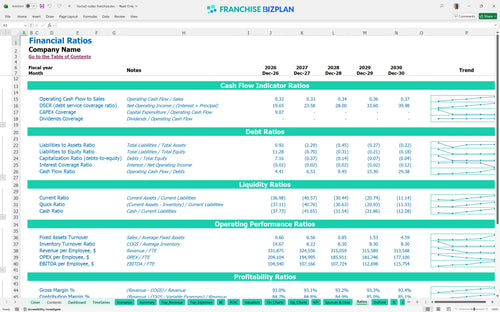
Performance metrics benchmark
We built this financial model template for extended-stay hotel investment using deep industry research on unit-level performance. Key assumptions like B2B corporate contract revenue and $18.2 million in initial CAPEX are pre-populated and fully editable to fit your specific market. You get a ready-to-use tool that tracks everything from $75,000 monthly rent to 6% royalty structures without building from scratch.
This hotel profitability projection spreadsheet shows the unit reaching a positive EBITDA of $2.09 million in its first year. While operational breakeven happens fast, the high initial investment means you are playing a long-term equity game. Net profit scales steadily as revenue climbs toward the $9.7 million mark by the end of the fifth year.
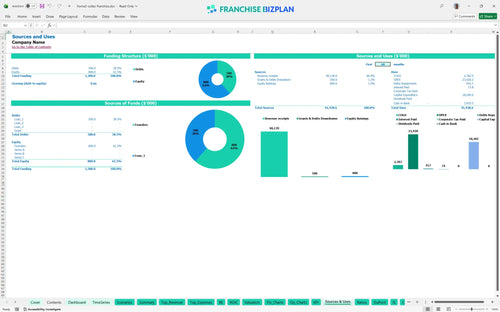
You need significant liquidity to learn how to calculate startup costs for a hotel franchise of this scale, with total uses exceeding $18 million. The bulk of your capital goes into the $10 million leasehold improvements and $4 million for building furnishings. You also need to budget for $1.2 million in IT systems and an $800,000 pre-opening fund to cover early staff and marketing.
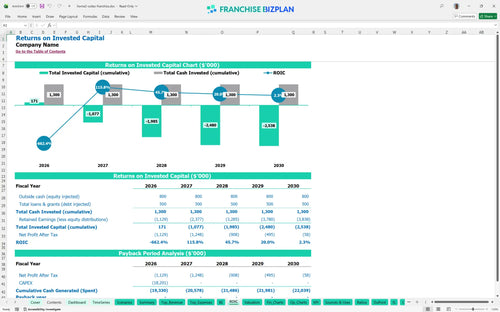
The ROI analysis for franchise hospitality development shows a payback period extending beyond the initial five-year window. With an IRR of -0.83% and an ROE of -4.8, this asset is defintely a long-term play focused on terminal value and principal paydown. Cash flow is strong at the store level, but the heavy $18 million entry price dictates the overall return profile.
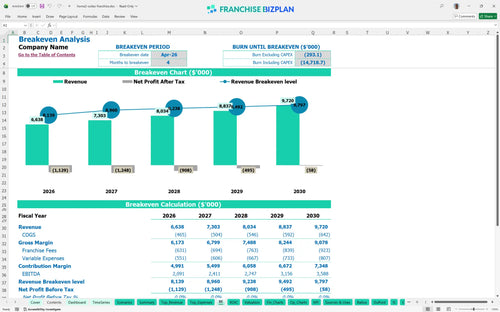
The unit hits its operational break-even date in April 2026, just four months after launching. Estimating labor and operational costs for extended-stay hotels is the key here, as you must cover $160,000 in monthly fixed costs including rent and insurance. High-volume extended stay room revenue is the primary driver that pushes you past this threshold quickly.
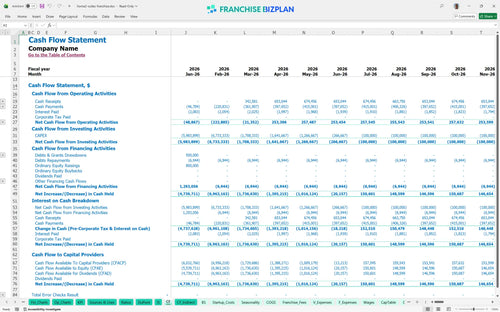
Your franchise investment feasibility study template identifies a lowest cash point of -$15.87 million in June 2026. This reflects the massive outflow for construction and FF&E (furniture, fixtures, and equipment) before stabilized revenue kicks in. You must ensure your construction loan or equity pool covers this gap plus a 10% buffer for unexpected delays.
Analyzing B2B corporate contract revenue in hotel models shows that the High scenario can significantly boost your $6.6 million base revenue. A 10% lift in RevPAR forecasting (Revenue Per Available Room) drastically improves the year-one EBITDA margin and shortens the path to a positive IRR. Conversely, the Low case highlights the risk of high fixed costs like the $75,000 monthly lease.
Finance: update unit break-even and payback model by Friday
This hotel franchise financial model is fully customizable in Excel, providing a professional-grade hospitality investment analysis template for serious operators. You can easily adjust pre-filled formulas and editable assumptions to match your specific territory, local labor rates, and real estate costs. It is designed to handle the complexity of multi-revenue stream assets without the usual spreadsheet headaches.

Success in the lodging sector requires looking past the grand opening, so we built this model to support creating a 5-year financial projection for hotel operations. You can track the transition from initial construction to a stabilized asset, with revenue growing from $6.6 million in year one to over $9.7 million by year five. This long-term view is essential for securing debt and aligning with equity partners on exit timing.

Operating under a major brand involves specific financial obligations that can squeeze margins if not modeled correctly. This tool simplifies assessing franchise royalty and marketing fees in Excel by applying a 6% royalty and 3.5% marketing fund contribution against your gross room sales. It ensures you see the true net cash flow after the brand takes its cut, including the initial $250,566 franchise fee payment.

The build-out for a large-scale hotel is a massive undertaking that requires precise capital expenditure (CAPEX) planning. Our model functions as a franchise startup cost calculator, accounting for $10 million in leasehold improvements and $4 million in furnishings. You will see exactly how much capital is tied up before the first guest checks in and what sales volume is needed to reach a stable break-even point.

We use best practices for hotel franchise financial forecasting by including benchmarks for occupancy rate modeling and labor efficiency. If your housekeeping supplies exceed 4.5% of revenue or your utilities spike above $30,000 monthly, the model helps you identify those variances quickly. These guardrails help you sanity-check your pro forma against typical extended-stay performance standards.


Simply purchase and download the financial model template, then access it instantly using Microsoft Excel or Google Sheets. No installation or technical expertise required-just open and start working.

Enter your business-specific numbers, including revenue projections, costs, and investment details. The pre-built formulas will automatically calculate financial insights, saving you time and effort.

Leverage the investor-ready format to confidently showcase your financial projections to banks, franchise representatives, or investors. Impress stakeholders with clear, data-driven insights and professional reports.

Leverage the investor-ready format to confidently present your projections to banks, franchise representatives, or investors.