
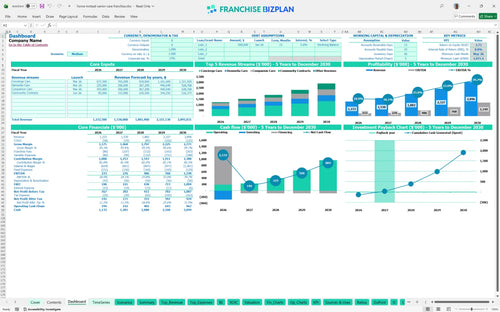
All-in-one Dashboard
Core inputs and core outputs


This Excel template for senior home care franchise business model provides a complete toolkit for forecasting revenue, managing expenses, and calculating investor returns.
Core inputs and core outputs
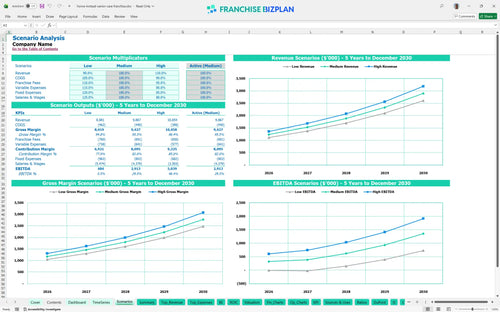
Three scenario analysis
Presentation ready
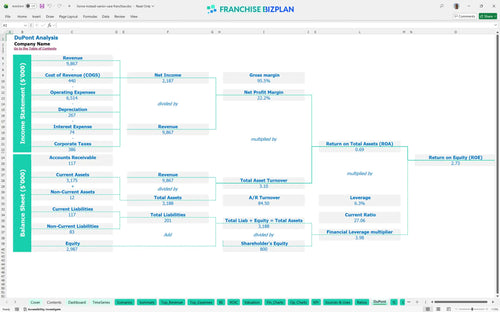
DuPont analysis
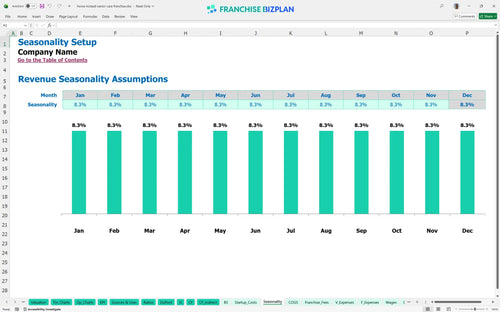
Researched revenue assumptions
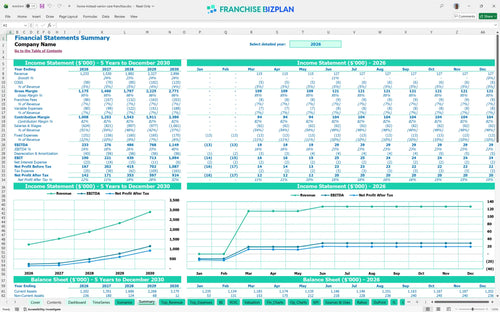
Lender-friendly financial outputs
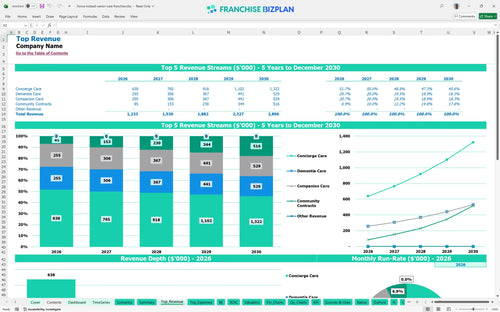
Revenue stream detailed view
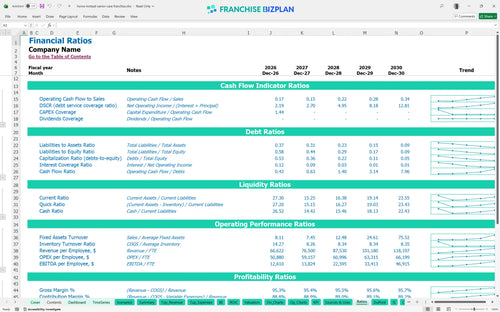
Performance metrics benchmark
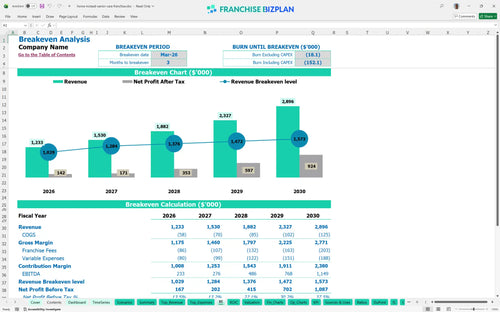
This home care franchise business plan template is built on deep research into the senior services sector. We have pre-populated the model with data showing a Year 1 revenue of $1,233,000 and an EBITDA of $233,000, all of which you can edit to fit your local market reality. Data beats guessing every single time.
The unit is projected to reach profitability defintely by March 2026, just three months after launching. With Year 5 EBITDA hitting $1,149,000, the senior care franchise profitability analysis shows a strong upward curve as your community contracts and specialized care tiers mature. Three months to break-even is a fast ramp.
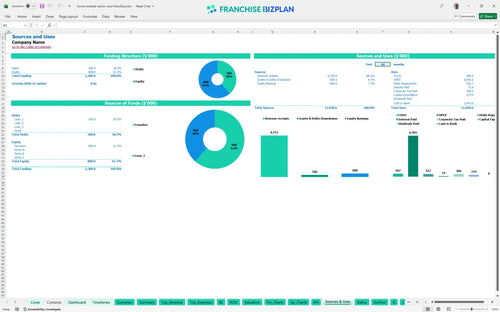
You will need $279,000 in total capital to cover the initial startup costs for this senior care franchise. This includes the $54,000 franchise fee, $80,000 for office improvements, and $45,000 for company vehicles to ensure your team is mobile and branded. Cash is king, but allocation is the kingdom.
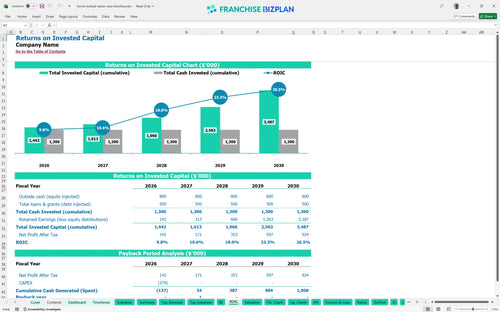
Investors can expect a 2-year payback period on their initial capital, which is highly competitive for the healthcare sector. The model shows an Internal Rate of Return (IRR) of 8.77% and a Return on Equity (ROE) of 2.73, based on the five-year growth plan. Two years to get your money back is solid.
The monthly break-even point occurs in March 2026, driven primarily by your ability to manage caregiver wages and mileage reimbursements. Since labor is your largest variable cost, maintaining a high caregiver-to-client ratio is the fastest way to cover your $12,700 monthly fixed expenses. Watch your caregiver hours like a hawk.
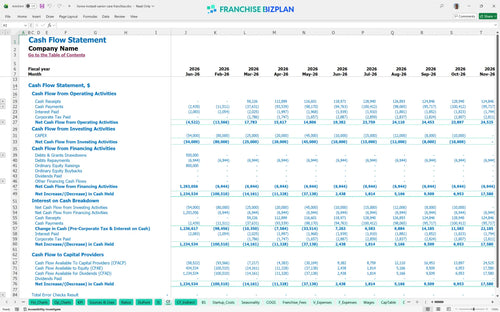
The lowest cash point is $1,071,000 in May 2026, suggesting you should maintain a significant liquidity buffer to handle the ramp-up phase. This senior care franchise operational expenses spreadsheet accounts for the timing gap between paying caregivers and receiving private-pay client fees. Keep a buffer for the unexpected.
The healthcare franchise financial forecasting tool allows you to toggle between Low, Medium, and High cases to see how a 10% drop in revenue impacts your Year 1 margin. Even in a conservative scenario, the low fixed-to-variable cost ratio helps protect the bottom line during slow months. Plan for the worst, but execute for the best.
Finance: update unit break-even and payback model by Friday.
This senior care franchise financial model is built entirely in Excel, giving you total control over every variable. You can adjust pre-filled formulas and editable assumptions to match your specific territory, whether you are looking at a high-density urban area or a sprawling suburban market. Excel is the gold standard for a reason.

Plan your long-term growth with a healthcare franchise financial projection template that covers five full years of operations. The model tracks revenue, costs, and cash flow to show how your margins evolve as you scale from a few clients to a full roster. Five years is the sweet spot for seeing your exit.

Managing the math on royalties and brand funds is critical for maintaining your store-level margin. This tool shows you exactly how to analyze franchise royalty and fee structures by calculating the 5% royalty and 2% marketing fund against your monthly gross sales. Royalties are the price of brand power.

Use this franchise startup cost spreadsheet to map out your initial $279,000 investment, from the franchise fee to your first company vehicles. It helps you identify the exact sales volume needed to cover your $6,500 monthly rent and other fixed overhead. Knowing your floor is as vital as knowing your ceiling.

We have integrated franchise unit economics benchmarks to help you verify if your labor costs or caregiver supplies are in line with industry standards. This allows you to sanity-check your projections against real-world performance data for non-medical home care agencies. Benchmarks keep your ego in check.


Simply purchase and download the financial model template, then access it instantly using Microsoft Excel or Google Sheets. No installation or technical expertise required-just open and start working.

Enter your business-specific numbers, including revenue projections, costs, and investment details. The pre-built formulas will automatically calculate financial insights, saving you time and effort.

Leverage the investor-ready format to confidently showcase your financial projections to banks, franchise representatives, or investors. Impress stakeholders with clear, data-driven insights and professional reports.

Leverage the investor-ready format to confidently present your projections to banks, franchise representatives, or investors.