
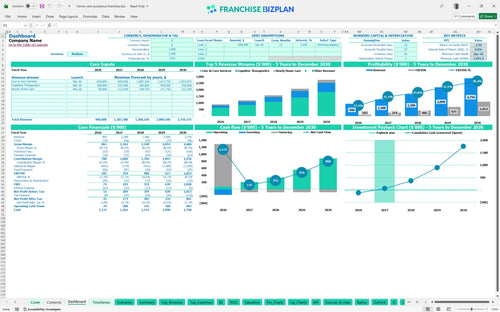
All-in-one Dashboard
Core inputs and core outputs


The template includes a complete set of interconnected financial statements, startup cost trackers, and automated charts designed specifically for a premium senior care agency.
Core inputs and core outputs
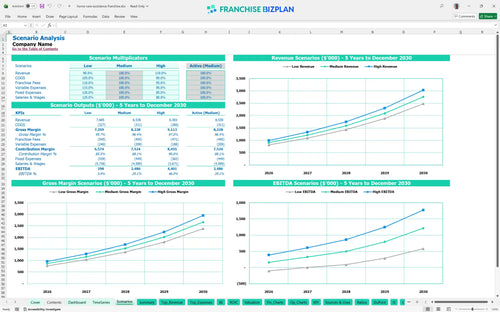
Three scenario analysis
Presentation ready
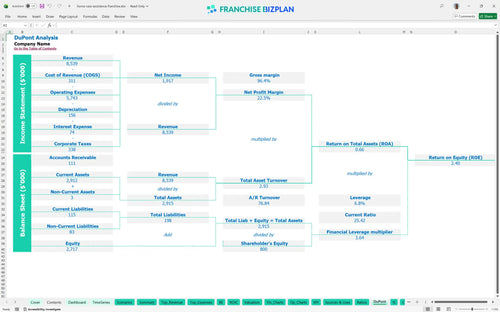
DuPont analysis
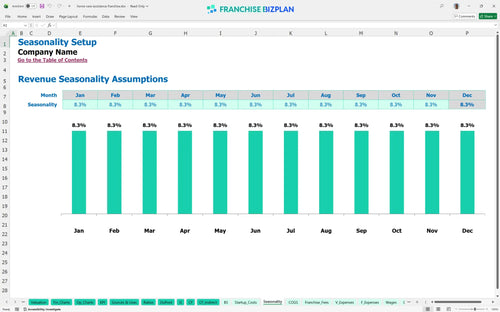
Researched revenue assumptions
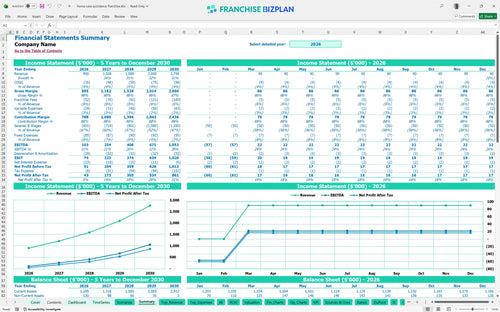
Lender-friendly financial outputs
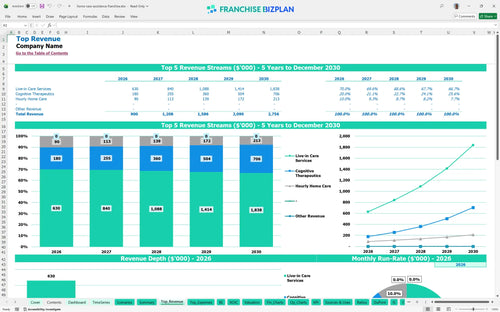
Revenue stream detailed view
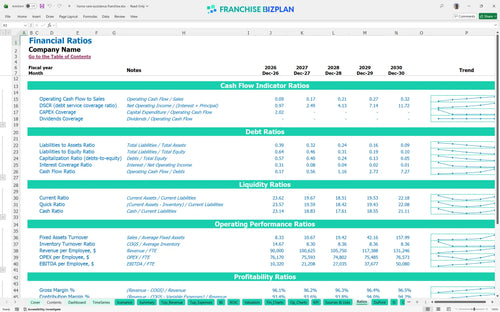
Performance metrics benchmark
We built this franchise unit financial model using our own research to provide a realistic roadmap for your investment. Key assumptions, including live-in care agency financial projections and royalty fees, are pre-populated with data like the $900,000 Year 1 revenue target and $103,000 EBITDA. Everything is fully editable, so you can tailor the numbers to your specific US territory and local market conditions.
The unit becomes profitable in Year 1, generating $103,000 in EBITDA after accounting for all operating costs and royalties. By Year 5, net profit scales significantly to $1,052,000 as you leverage fixed costs like the $4,200 monthly rent. Managing your caregiver recruitment overhead is the primary factor in maintaining this trajectory as you scale to 15 full-time caregivers.
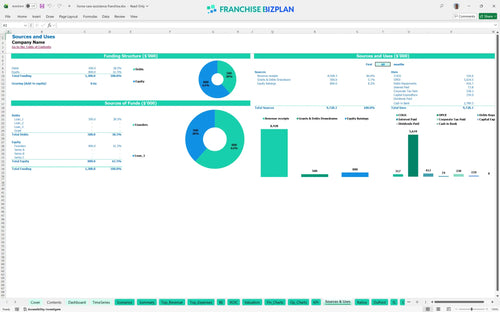
To launch this unit in the US, you need approximately $1.2 million, which includes a $1,043,000 cash buffer and $159,000 in senior care franchise startup costs. Major capital outlays include the $55,000 franchise fee, $28,000 for office leasehold improvements, and $20,000 for a company vehicle. This capital ensures you can cover the $85,000 general manager salary and marketing during the initial ramp-up.
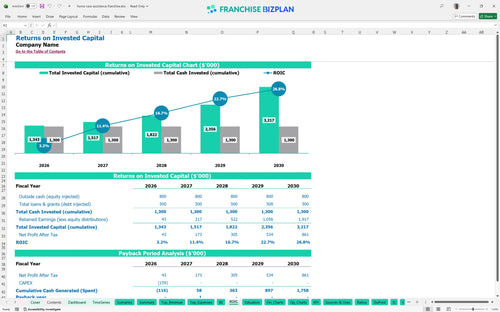
The model projects an Internal Rate of Return (IRR) of 8% and a Return on Equity (ROE) of 2.4. You will defintely see a full payback of your initial investment within 2 years. These returns are driven by a strong Year 5 EBITDA margin of 38%, which is achievable for premium agencies focusing on high-ticket live-in care and specialized brain health services.
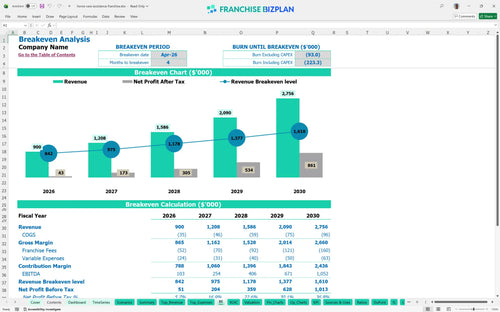
The monthly break-even point is reached in April 2026, just four months after the January launch. This private pay home care business model depends on hitting $420,000 in live-in care revenue in the first year to cover fixed monthly expenses like the $4,200 rent and $58,000 recruiter salary. Throughput and caregiver utilization are the biggest levers for hitting this date on time.
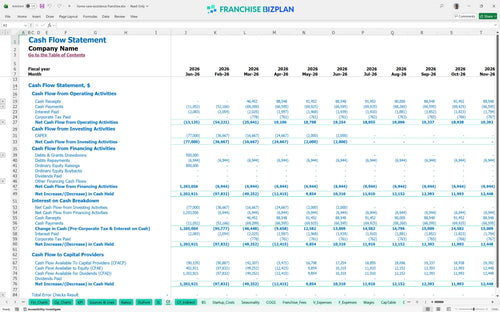
The lowest cash point occurs in April 2026 at $1,043,000, which covers the initial burn during the four-month ramp-up. You need this runway to handle home health care operational expenses before the business becomes self-sustaining. Having a substantial buffer is essential because any delay in caregiver hiring can quickly tighten your monthly cash flow.
Financial planning for premium home care agency units requires looking at Low, Medium, and High cases to understand risk. A High scenario, where Year 1 revenue exceeds $900,000, significantly improves your 11.4% Year 1 margin and shortens the payback period. Conversely, the Low case shows how a 10% drop in live-in care hours can push the break-even date back several months.
Finance: update unit break-even and payback model by Friday
This home care franchise financial model is built in Excel with fully editable assumptions and pre-filled formulas. You can easily adjust pricing, service mix, and local labor rates to see how specific changes impact your bottom line. It acts as a dynamic tool for testing different operating scenarios before you sign a lease or hire your first staff member.

Our home care business plan template provides a detailed 5-year outlook on your agency's growth. It maps out the transition from a single-unit startup to a mature operation, forecasting revenue from $900,000 in Year 1 to over $2.7 million by Year 5. This long-term view helps you plan for future staff expansions and territory development with confidence.

Understanding the franchise royalty fee structure is vital for maintaining store-level margins. This model automatically calculates the 5% royalty and 0.8% marketing fund contributions based on your monthly sales. It ensures you account for every dollar owed to the franchisor, including the initial $55,000 fee, so your net profit numbers are always accurate and realistic.

This franchise unit profit and loss template breaks down your total initial investment into clear categories like leasehold improvements and equipment. By comparing these startup costs against your projected monthly margins, the model identifies exactly when your unit will stop burning cash. It simplifies the math behind your break-even sales targets and total capital requirements.

We include aging in place market analysis data to help you sanity-check your local projections against industry standards. The model compares your labor costs and rent against typical ranges for premium senior care units. This prevents you from being too optimistic about margins and helps you identify potential 'leaks' in your operational plan before they happen.


Simply purchase and download the financial model template, then access it instantly using Microsoft Excel or Google Sheets. No installation or technical expertise required-just open and start working.

Enter your business-specific numbers, including revenue projections, costs, and investment details. The pre-built formulas will automatically calculate financial insights, saving you time and effort.

Leverage the investor-ready format to confidently showcase your financial projections to banks, franchise representatives, or investors. Impress stakeholders with clear, data-driven insights and professional reports.

Leverage the investor-ready format to confidently present your projections to banks, franchise representatives, or investors.