
All-in-one Dashboard
Core inputs and core outputs


This comprehensive Excel template provides a turn-key solution for projecting the financial performance of a high-volume fuel and retail location. Everything you need is under the hood.
Core inputs and core outputs
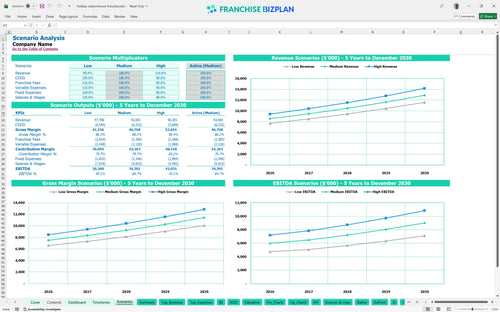
Three scenario analysis
Presentation ready
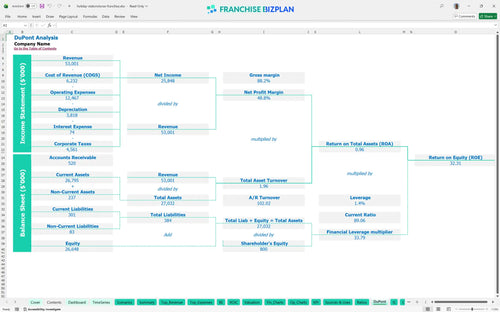
DuPont analysis
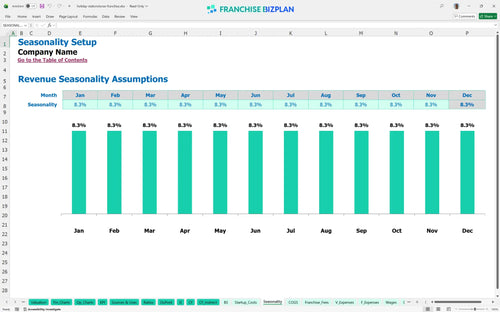
Researched revenue assumptions
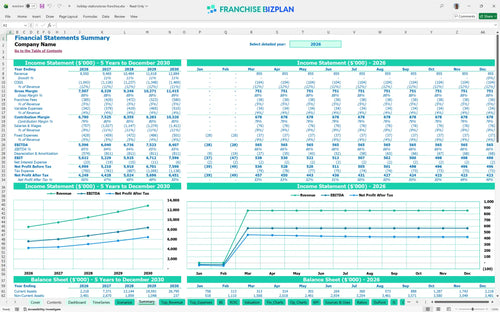
Lender-friendly financial outputs
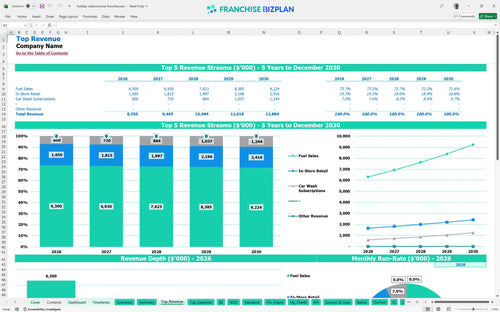
Revenue stream detailed view
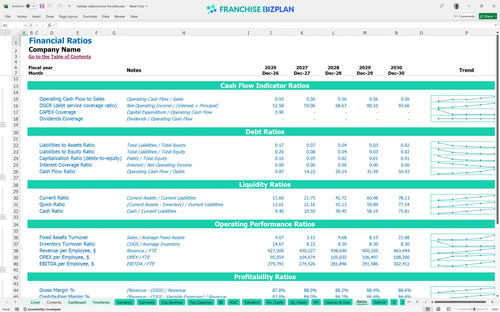
Performance metrics benchmark
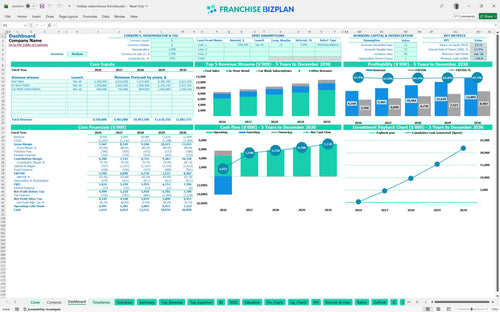
We built this convenience store franchise financial model using detailed research on high-traffic retail and fuel operations. Key assumptions, including the $25,000 franchise fee, 24-hour staffing requirements, and car wash subscription revenue, are pre-populated with researched data specific to Holiday Stationstores Franchise franchise unit and are fully editable. This tool provides a realistic look at a unit generating over $8.5M in year-one revenue.
The unit hits the ground running with a projected Year 1 EBITDA of $5,596,000, growing to $8,407,000 by Year 5 as car wash subscriptions and in-store retail mature. Profitability is achieved almost immediately due to high volume, though net cash is impacted by the heavy initial build-out. Margins are won in the aisles, not just at the pump.
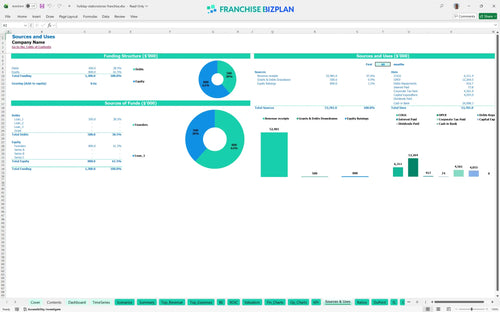
Launching this unit requires a total initial investment of approximately $4,055,000 to cover the extensive physical infrastructure and fuel systems. This includes everything from the $25,000 franchise fee to the $1.1M fuel storage tank installation. Capital is fuel; don't run out before the highway.
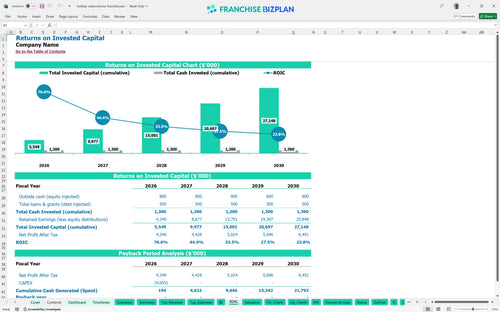
Investors can expect an Internal Rate of Return (IRR) of 13.92% and a Return on Equity (ROE) of 32.31%. While the annual cash flow is strong, the massive $4M+ initial CAPEX means the full payback period extends just past the five-year mark. Patience pays, but only if the IRR justifies the wait.
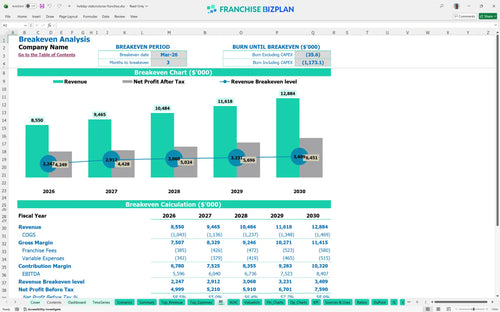
The model projects a break-even point in March 2026, just three months after the initial model start, driven by the high-volume fuel sales and $22,000 monthly rent. Reaching this point quickly is critical given the $37,100 in monthly fixed operating costs excluding labor. Volume is the lever that moves the break-even needle.
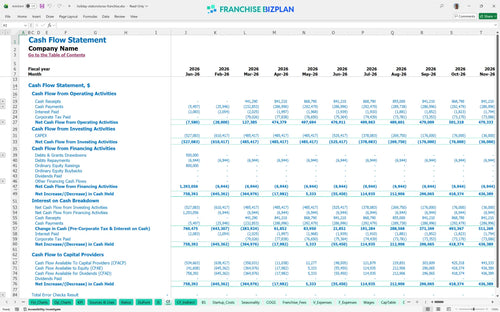
The lowest cash point occurs in June 2026 at -$320,000, primarily due to the timing of equipment payments for the car wash and POS systems. You will need a significant working capital buffer to navigate the first six months of operations while CAPEX installments are still being paid. Cash is oxygen; the ramp-up is a high-altitude climb.
A 10% drop in fuel volume significantly delays the payback period, while a high-performance scenario with car wash growth can push Year 1 EBITDA past $6M. The model allows you to test how a 1-point shift in merchandise COGS or a rise in assistant manager wages affects your peak cash need. Plan for the best, but build for the worst.
This convenience store franchise financial model is built in Excel with fully editable assumptions, allowing you to swap out local variables without breaking the core logic. You can adjust everything from fuel margins to car wash subscription growth to see how local competition affects your bottom line. Control your numbers, don't let them control you.

Map out the long-term health of your gas station franchise financial model with detailed projections for revenue, EBITDA, and cash flow through 2030. This tool helps you visualize the transition from the heavy construction phase to a mature, high-volume retail operation. Five years of foresight beats five months of guessing.

The model automatically calculates your franchise royalty fee structure, including the 3.5% royalty and 1.0% marketing fund contributions based on your gross sales. This ensures you see the true net margin after the franchisor takes their cut of the top-line revenue. Royalties are a top-line tax that never sleeps.

Use the franchise startup cost template to estimate your total entry cost, which defintely helps in securing financing or planning your personal equity injection. The model identifies the exact month your retail franchise profitability analysis turns positive, covering both fixed rent and variable labor. Speed to break-even is the only metric that settles the stomach.

We have integrated standard retail franchise profitability analysis metrics so you can compare your projected performance against typical convenience store operations. This helps you verify if your $22,000 monthly rent or your 11% merchandise COGS (Cost of Goods Sold) aligns with industry norms. Benchmarks keep your optimism grounded in reality.


Simply purchase and download the financial model template, then access it instantly using Microsoft Excel or Google Sheets. No installation or technical expertise required-just open and start working.

Enter your business-specific numbers, including revenue projections, costs, and investment details. The pre-built formulas will automatically calculate financial insights, saving you time and effort.

Leverage the investor-ready format to confidently showcase your financial projections to banks, franchise representatives, or investors. Impress stakeholders with clear, data-driven insights and professional reports.

Leverage the investor-ready format to confidently present your projections to banks, franchise representatives, or investors.