
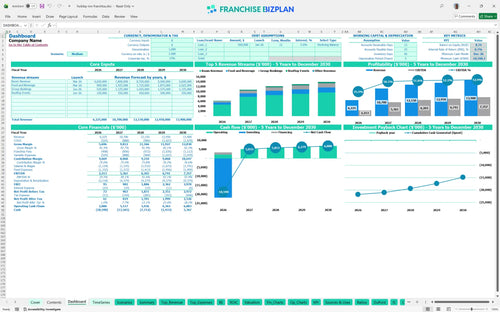
All-in-one Dashboard
Core inputs and core outputs


This hotel business plan template provides a complete financial toolkit for hospitality operators, including 5-year projections, CAPEX schedules, and dynamic revenue drivers for rooms and events.
Core inputs and core outputs
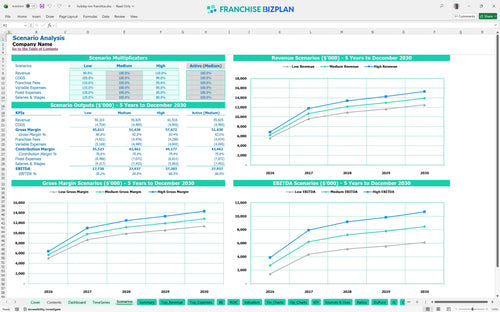
Three scenario analysis
Presentation ready
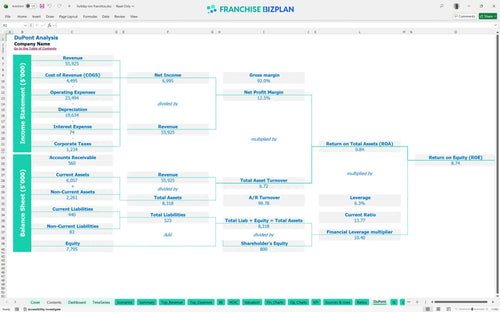
DuPont analysis
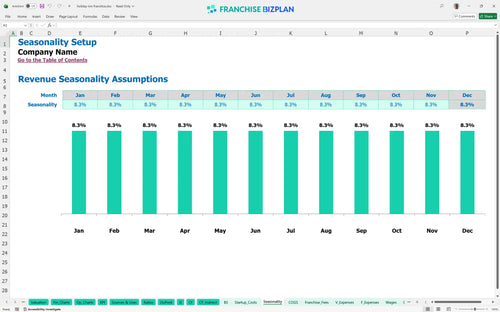
Researched revenue assumptions
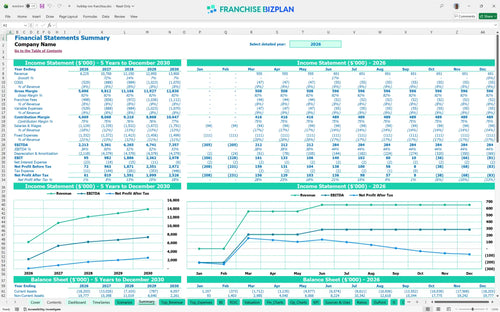
Lender-friendly financial outputs
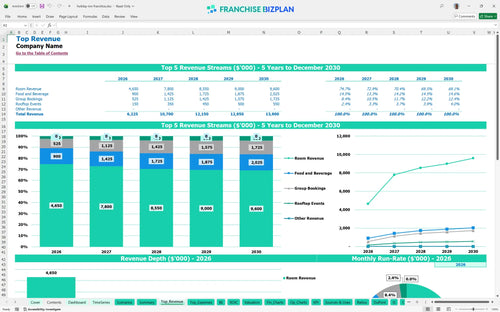
Revenue stream detailed view
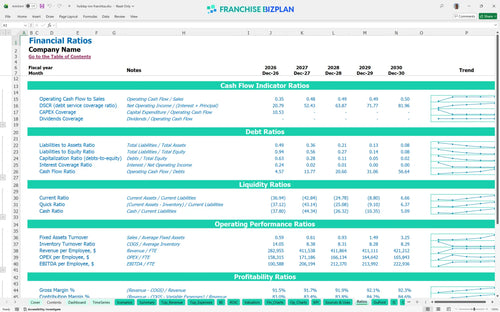
Performance metrics benchmark
We developed this hotel franchise market feasibility and financial planning tool using researched data on urban hospitality units. Key assumptions like the $6.225 million year-one revenue and the 5% royalty fee are pre-populated and fully editable to match your specific territory. We did the heavy lifting so you can focus on the guest experience and local demand.
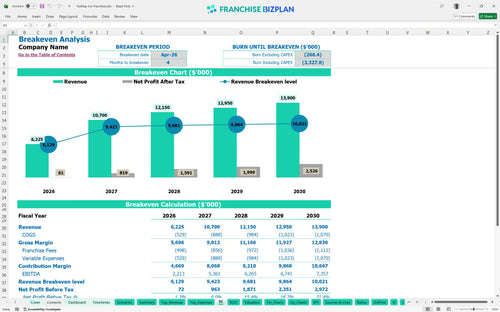
Your unit hits break-even in April 2026, reaching profitability within the first year of operation. Projecting hotel food and beverage revenue alongside room sales is key, as EBITDA grows from $2.2 million in year one to $7.3 million by year five.
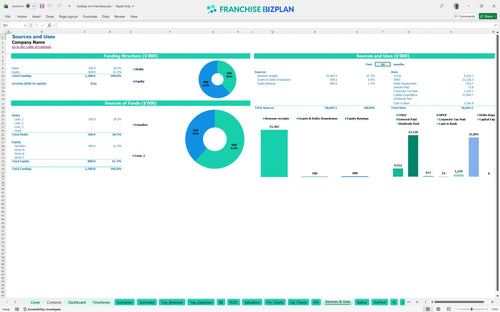
You need $21.9 million in capital, primarily for leasehold improvements and FF&E. This hotel development budget spreadsheet for investors tracks every dollar, from the $94,700 franchise fee to the $2 million rooftop lounge buildout and CAPEX (Capital Expenditure, or money spent on physical assets).
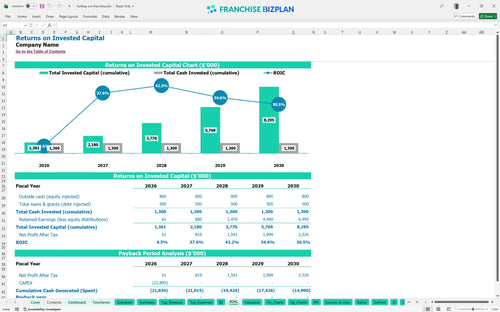
This investment return calculator for hotel franchise shows an IRR of 0.67% and an ROE of 8.74%. To be fair, this is a long-term marathon play with payback occurring after year five, which is standard for high-end hospitality ROI analysis in urban districts.
Break-even occurs in April 2026 once monthly revenue covers fixed costs like the $45,000 rent and $22,000 utilities. A solid hotel revenue management strategy is required to manage the 6.5% OTA (Online Travel Agency, like Expedia or Booking.com) commission fees that eat into margins.
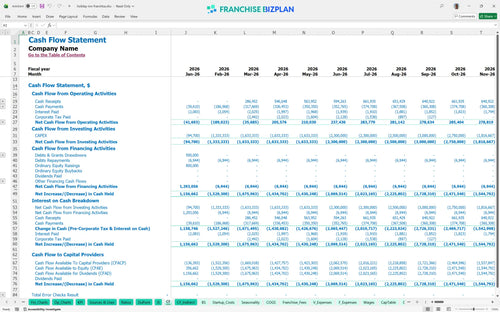
The lowest cash point is -$18.59 million in December 2026, requiring careful Excel template for hotel franchise cash flow forecasting. You must secure a rock-solid capital stack to survive the ramp-up losses and the massive initial build-out phase before mature-unit performance kicks in.
High scenarios improve your $2.2 million year-one EBITDA by optimizing your revenue management strategy and event capture. This hotel franchise profitability analysis Excel template shows that high-case success defintely depends on hitting your $1.35 million food and beverage targets by year five.
This hotel franchise financial model is fully customizable in Excel to fit your specific market and operating scenario. Every cell is open, allowing you to edit pre-filled formulas and assumptions for EBITDA (Earnings Before Interest, Taxes, Depreciation, and Amortization) to ensure the numbers match your local reality.

Five-year projections provide a clear roadmap from a $6.2 million year-one start to long-term maturity at $13.9 million. These franchise hotel business plan financial projections include detailed revenue, cost, and cash flow views so you can plan for multi-unit growth or single-store stability.

Managing the franchise royalty fee structure is simple with dedicated inputs for the 5% royalty and 3% marketing fund contributions. The model captures these ongoing obligations-where a royalty is a percentage of gross sales paid to the brand-so you see the true store-level margin.

Startup planning covers the $21.9 million initial investment and identifies the April 2026 break-even date. Knowing how to calculate startup costs for a hotel franchise is vital, as it helps you balance the $12 million build-out against your monthly fixed and variable cost structure.

Built-in benchmarks allow for a detailed hotel investment feasability study against hospitality standards for labor and occupancy. Comparing your 28% labor cost or $45,000 monthly rent to industry norms keeps your plan realistic and helps you sanity-check every revenue driver.


Simply purchase and download the financial model template, then access it instantly using Microsoft Excel or Google Sheets. No installation or technical expertise required-just open and start working.

Enter your business-specific numbers, including revenue projections, costs, and investment details. The pre-built formulas will automatically calculate financial insights, saving you time and effort.

Leverage the investor-ready format to confidently showcase your financial projections to banks, franchise representatives, or investors. Impress stakeholders with clear, data-driven insights and professional reports.

Leverage the investor-ready format to confidently present your projections to banks, franchise representatives, or investors.