


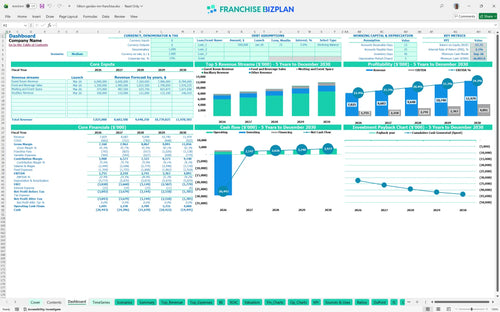
All-in-one Dashboard
Core inputs and core outputs



This Excel financial template for hospitality business includes a detailed hotel operating budget spreadsheet, startup cost tracker, and a five-year cash flow forecast.
Core inputs and core outputs
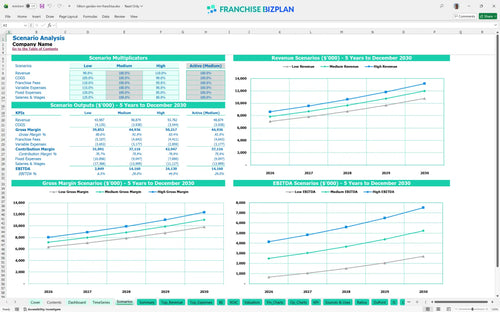
Three scenario analysis
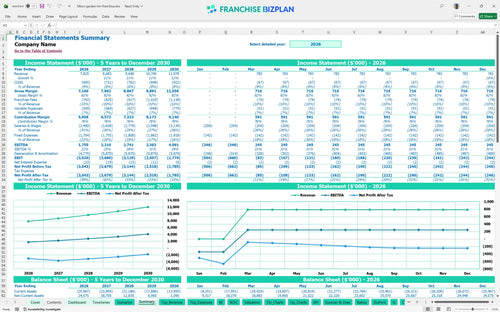
Presentation ready

DuPont analysis
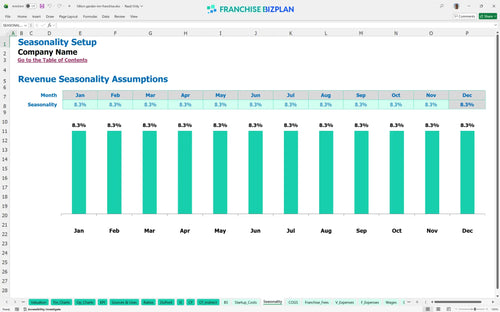
Researched revenue assumptions

Lender-friendly financial outputs

Revenue stream detailed view
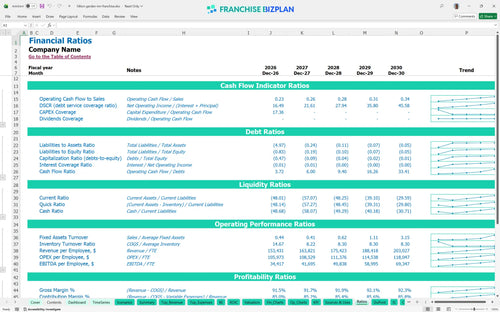
Performance metrics benchmark
We built this hotel unit financial projection using deep research into mid-scale hospitality economics. Key assumptions, including guest room revenue starting at $4,000,000 and staffing for 45 hourly associates, are pre-populated with researched data and are fully editable. This model helps you evaluate if the $1.75 million year-one EBITDA aligns with your portfolio goals.
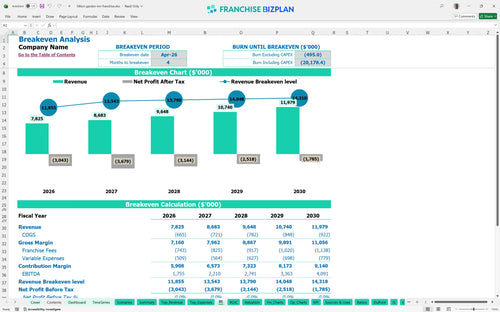
The model shows the unit hitting its break-even date in April 2026, just four months after the doors open. While monthly operations turn positive quickly, the massive $29.35 million initial investment means true net profitability takes time to accumulate. Break-even depends on how fast you can fill beds once the doors open.
You need approximately $29.35 million to launch this unit, covering everything from the $100,000 franchise fee to the $18 million leasehold improvements. This commercial real estate hotel investment model accounts for $3.5 million in room FF&E and a $350,000 pre-opening buffer. Here's the quick math: you're spending nearly $30 million before the first guest checks in.
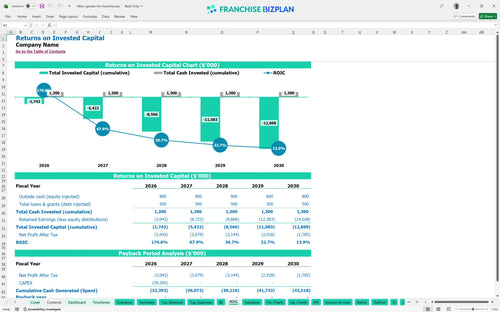
The hotel franchise ROI calculation guide indicates a payback period extending beyond the first five years due to the heavy upfront build-out. With an IRR of -2.08% over the initial 5-year window, this is a long-term play focused on asset appreciation and steady EBITDA growth. This is a marathon, not a sprint.
You reach break-even in month 4, provided you hit the projected $7.8 million in year-one revenue. The biggest hurdle to staying in the black is the $142,000 in monthly fixed costs, including $50,000 for rent and $25,000 for property taxes. Every empty room is a lost margin opportunity you can't get back.
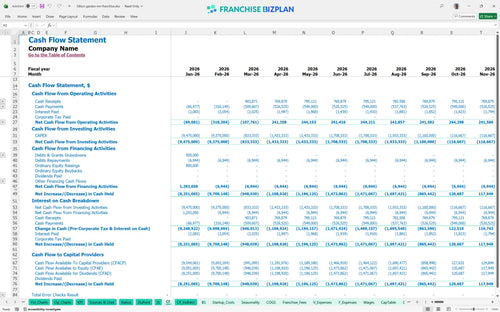
The lowest cash point hits in September 2026, reaching a deficit of $26.8 million during the heavy construction and fit-out phase. You defintely need a robust financing plan to cover the gap between the start of construction and stabilized operations. Cash is oxygen during the 9-month build-out phase.
Projecting food and beverage revenue for hotels involves risk; a 10% drop in guest room sales significantly delays the break-even month. Conversely, a high-performance scenario where ancillary revenue and event space sales exceed targets can push Year 5 EBITDA toward $4.5 million. Small wins in occupancy create big swings in net profit.
Finance: update unit break-even and payback model by Friday.
This hotel franchise financial model is fully customizable in Excel, featuring pre-filled formulas and editable assumptions that allow you to adapt the projections to your specific territory, local labor market, and property size. You can easily adjust room rates or occupancy targets to see how they impact your hospitality franchise investment analysis.

Planning a mid-scale hotel franchise investment feasibility study requires a long-term view of cash flow and debt service. This model provides detailed 5-year projections, showing revenue climbing from $7.8 million in year one to nearly $12 million by year five, helping you map out the path to stabilized operations.

The model captures the specific financial obligations of the brand relationship, including the 5.5% franchise royalty fees and 4.0% marketing fund contributions. By including the initial $100,000 franchise fee, you can see the real economics of operating under a global brand umbrella before local overhead kicks in.

Use this hotel startup cost calculator to estimate the total initial investment, including the $18 million for leasehold improvements and $3.5 million for room furnishings. The model identifies the monthly break-even sales level required to cover fixed costs like your $50,000 monthly rent and property insurance.

This model incorporates built-in franchise unit financial performance benchmarking to help you sanity-check your operating assumptions. You can compare your expected 5.5% food cost and guest supply expenses against typical industry ranges to ensure your operational cost analysis for boutique hotel franchises is accurate.


Simply purchase and download the financial model template, then access it instantly using Microsoft Excel or Google Sheets. No installation or technical expertise required-just open and start working.

Enter your business-specific numbers, including revenue projections, costs, and investment details. The pre-built formulas will automatically calculate financial insights, saving you time and effort.

Leverage the investor-ready format to confidently showcase your financial projections to banks, franchise representatives, or investors. Impress stakeholders with clear, data-driven insights and professional reports.

Leverage the investor-ready format to confidently present your projections to banks, franchise representatives, or investors.