
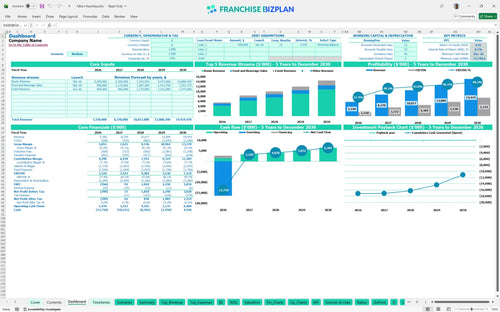
All-in-one Dashboard
Core inputs and core outputs


This comprehensive toolkit provides a professional-grade Excel framework for analyzing the full lifecycle of a boutique hotel investment from initial build-out to year-five maturity.
Core inputs and core outputs
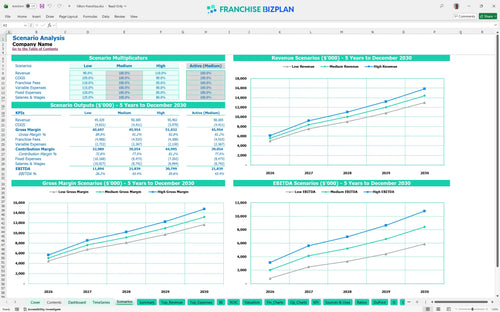
Three scenario analysis
Presentation ready
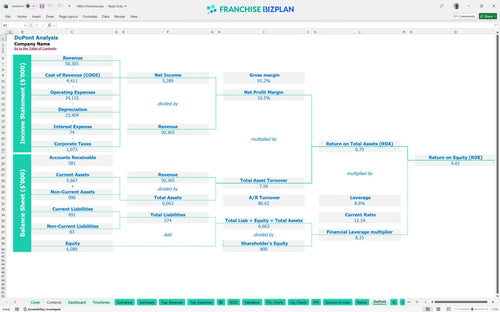
DuPont analysis
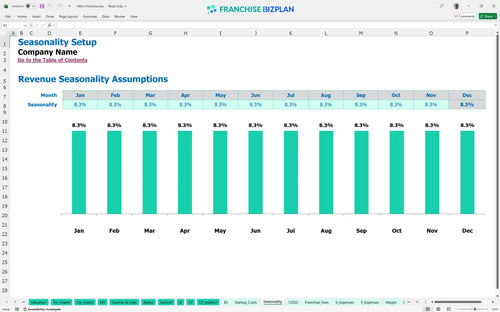
Researched revenue assumptions
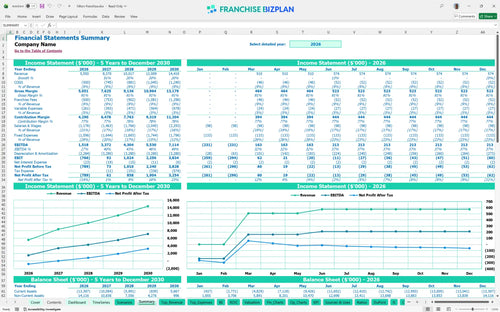
Lender-friendly financial outputs
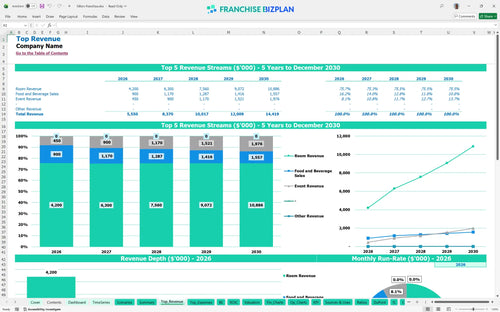
Revenue stream detailed view
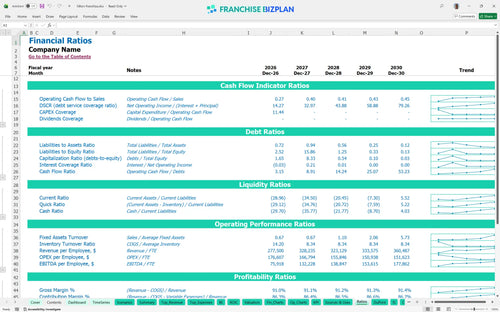
Performance metrics benchmark
We built this franchise unit financial model using extensive research into the boutique hospitality sector and premium brand standards. Key assumptions like the $8 million leasehold budget and the 5% royalty structure are pre-populated but fully editable to match your specific site in the Charleston Historic District. With Year 1 EBITDA projected at $1.518 million and a break-even point reached in just 4 months, this model provides a data-driven roadmap for your investment.
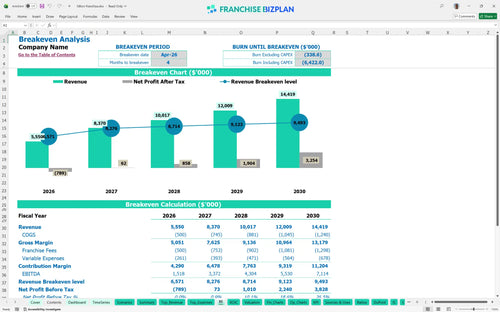
The unit reaches operational profitability almost immediately, with a break-even date of April 2026. While Year 1 EBITDA is a healthy $1.518 million, the model shows significant scaling as revenue grows from $5.55 million to $14.4 million by Year 5. Profitability depends on maintaining a tight RevPAR forecasting (Revenue Per Available Room) strategy to cover the $45,000 monthly lease. High-margin event revenue and rooftop sales are the keys to boosting the bottom line.
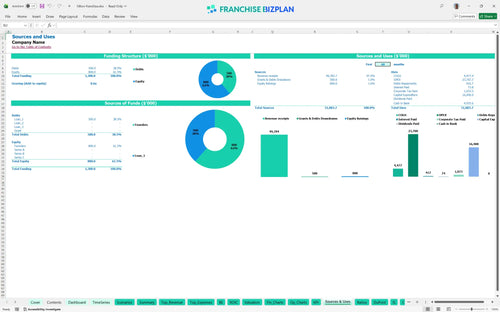
You will need approximately $16.4 million to get this unit off the ground, covering everything from the $100,000 franchise fee to the $8 million in leasehold improvements. The hospitality franchise operating cost breakdown also includes $2.5 million for guest room furnishings and $3 million for HVAC systems. This capital is allocated to create a premium guest experience that justifies high RevPAR. Your opening cash buffer must account for the ramp-up phase before the April break-even.
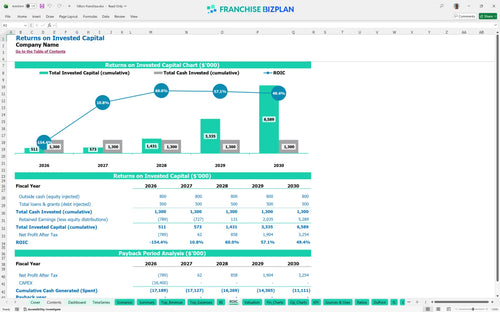
The model shows an Internal Rate of Return (IRR) of 0.69% and a Return on Equity (ROE) of 6.61, which suggests a long-term play rather than a quick flip. Payback on the total investment occurs after Year 5, which is typical for a commercial real estate hotel investment analysis of this scale. While the IRR looks low, the EBITDA growth to $7.1 million by Year 5 provides a strong exit valuation potential. Investors should focus on the steady cash flow and asset appreciation in a prime historic district.
Monthly break-even is achieved when revenue covers the $133,000 in core fixed costs, including the $45,000 lease and $25,000 in utilities. The primary driver for reaching this point is Room Revenue, which is projected to hit $2.8 million in the first year. If your booking commissions (3.5%) or royalty fees (5%) rise, your break-even volume defintely moves higher. Speed to market is essential, as the model assumes a 4-month window to stop the initial cash burn.
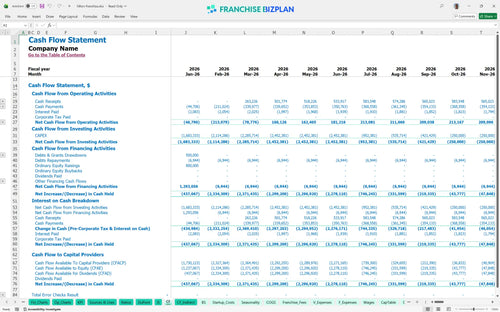
The lowest cash point occurs in December 2026, with a projected minimum cash requirement of -$13.75 million. This reflects the heavy front-loaded CapEx for the rooftop lounge fitout and IT infrastructure before the property fully stabilizes. You need a significant capital reserve or a robust construction loan to bridge the gap between the $16.4 million spend and the rising EBITDA. Financial planning for boutique hotel owners must prioritize this liquidity gap to avoid mid-project funding stalls.
In a High scenario, where revenue management strategy for hotel franchises increases RevPAR by 10%, Year 1 EBITDA could jump significantly, shortening the payback period. Conversely, a Low scenario with 10% higher labor costs or lower occupancy would push the lowest cash point even deeper into the red. The model allows you to stress-test these variables to see how a 1-point margin leak affects your debt service coverage. Success in the High case relies on local marketing execution and capturing corporate event spend.
Finance: update unit break-even and payback model by Friday.
This hotel franchise financial model is built in Excel with fully editable assumptions, allowing you to plug in your specific location data and local market variables. We have pre-filled the formulas so you can adjust room rates, seasonal occupancy, and food and beverage margins without breaking the logic. It is a flexible tool designed to handle the complexity of a hospitality business plan template while remaining simple enough for a quick sanity check. Every cell is open, so you can tweak the debt service coverage ratio (the ratio of cash available for debt servicing to interest, principal, and lease payments) to satisfy your lenders. One-click adjustments make it easy to see how a 5% shift in occupancy changes your bottom line.

Long-term planning is vital in hospitality because your ramp-up period and capital expenditure planning (budgeting for major physical assets) dictate your ultimate success. This model provides a detailed 5-year outlook, starting with Year 1 revenue of $5.55 million and scaling to over $14.4 million by Year 5. You can track how EBITDA (earnings before interest, taxes, depreciation, and amortization) grows from $1.518 million to $7.114 million as the unit matures. It gives you a clear view of the franchise profitability projection over a realistic horizon. Real growth happens when you move past the initial stabilization phase into peak performance years.

Operating under a major brand means managing a specific franchise royalty fee structure that impacts your monthly store-level margin. This model accounts for a 5% royalty fee and a 4% marketing fee, ensuring you see exactly how much cash leaves the property before you pay your local bills. We also included the initial $100,000 franchise fee in the startup costs so your initial liquidity needs are accurate. Understanding how to estimate franchise royalty and marketing fees is the difference between a profitable unit and a cash-flow crunch. Brand standards are non-negotiable, so we baked these costs directly into the recurring monthly outflows.

Launching a high-end hotel requires a massive upfront commitment, and this hotel startup cost calculator captures every dollar from leasehold improvements to signage. With a total development cost estimation model that includes $8 million for improvements and $3 million for HVAC systems, you can see the full scale of the investment. The model identifies your break-even date as April 2026, just four months after the projected launch. This rapid break-even assumes you hit your Room Revenue targets of $2.8 million in the first year. Knowing your survival revenue number helps you manage the pressure of a $16.4 million capital stack.

We use real-world hotel operating expenses to ensure your projections stay grounded in hospitality reality. The model includes benchmarks for labor, such as a General Manager at $160,000 and a full housekeeping team that scales with your occupancy. You can compare your guest amenity costs, set at 1.5% of revenue, against industry standards to ensure you aren't overspending on soaps and linens. This allows you to perform a franchise unit financial performance projection that actually stands up to scrutiny from experienced hotel investors. If your labor costs exceed 30% of revenue, the model will show you the immediate impact on your net margin.


Simply purchase and download the financial model template, then access it instantly using Microsoft Excel or Google Sheets. No installation or technical expertise required-just open and start working.

Enter your business-specific numbers, including revenue projections, costs, and investment details. The pre-built formulas will automatically calculate financial insights, saving you time and effort.

Leverage the investor-ready format to confidently showcase your financial projections to banks, franchise representatives, or investors. Impress stakeholders with clear, data-driven insights and professional reports.

Leverage the investor-ready format to confidently present your projections to banks, franchise representatives, or investors.