
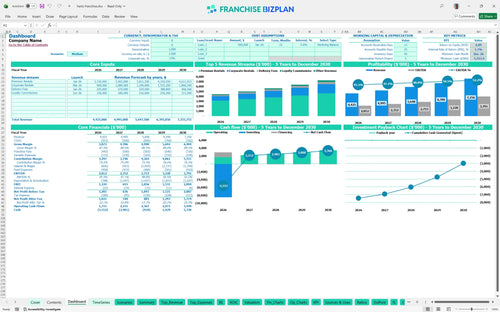
All-in-one Dashboard
Core inputs and core outputs


This template provides a complete toolkit for estimating fleet acquisition costs for vehicle rental franchise units and managing daily cash flow.
Core inputs and core outputs
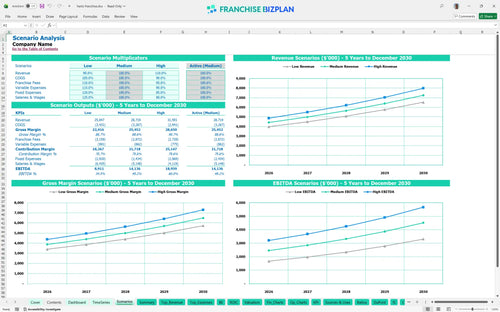
Three scenario analysis
Presentation ready
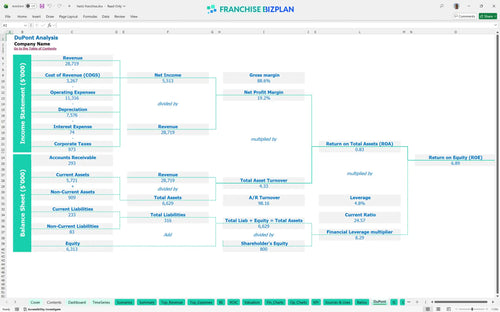
DuPont analysis
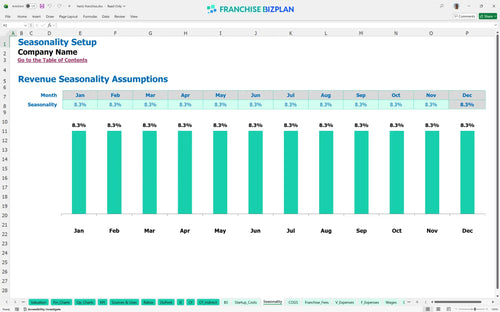
Researched revenue assumptions
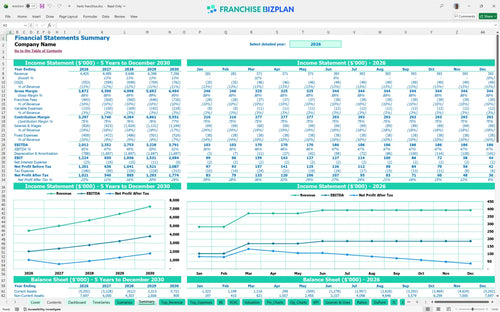
Lender-friendly financial outputs
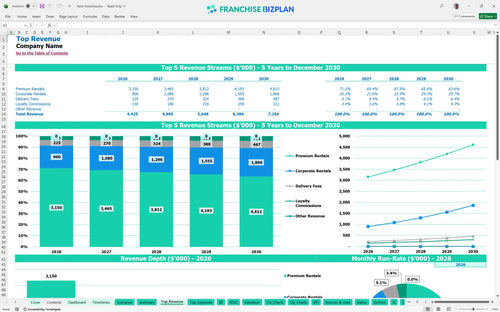
Revenue stream detailed view
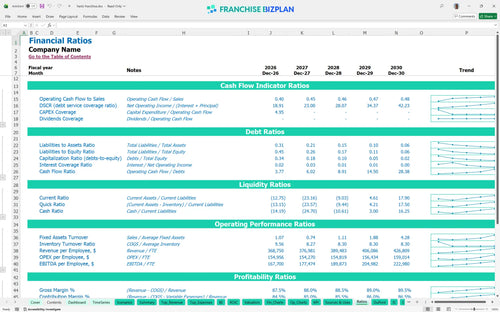
Performance metrics benchmark
We built this franchise unit financial model using our own research into the premium mobility sector. Key assumptions, including the $4.42M year-one revenue and 8% royalty fees, are pre-populated and fully editable to match your specific territory. This tool helps you navigate the complex unit economics of a high-CAPEX business with confidence.
Evaluating profitability of luxury vehicle rental franchise units requires looking at the $2.01M Year 1 EBITDA, which grows to $3.79M by Year 5. While the unit hits operational break-even in month one, the high initial investment means you are playing a long-term equity game. High revenue doesn't always mean fast payback in asset-heavy models.
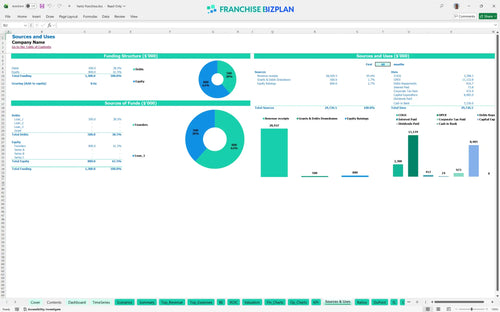
Capital expenditure planning shows you need significant liquidity to launch, with $7.5M allocated to the initial fleet and $125,000 for the franchise fee. Total startup costs exceed $8.4M when you include $450,000 for leasehold improvements and $120,000 for POS systems. Cash is the oxygen of any rental fleet operation.
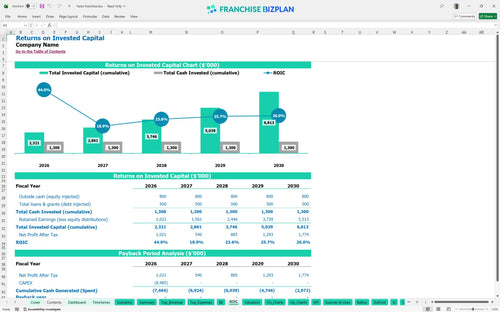
Fleet management ROI is reflected in the 1.72% IRR and a 6.89% Return on Equity. While the payback period extends beyond five years, the model shows you building substantial fleet equity while maintaining an average net margin that supports ongoing operations. Equity builds in the fleet even when net margins feel thin.
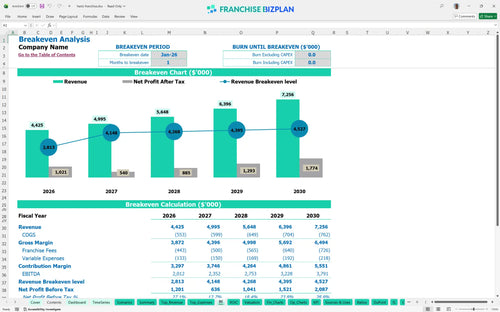
A franchise unit break-even analysis shows a fast start in January 2026, just one month after launch. This is possible because the $2.1M in premium rental revenue quickly covers the $28,000 monthly rent and the $425,000 annual management payroll. Speed to break-even reduces your total risk exposure.
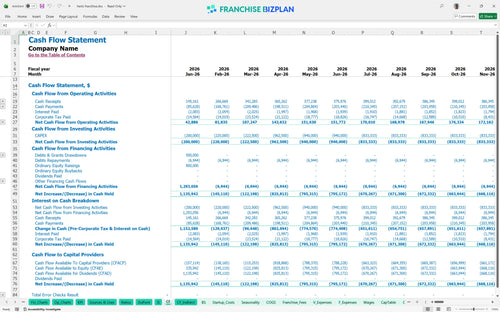
Learning how to build a cash flow statement for a franchise reveals a lowest cash point of -$5.55M in December 2026. You must secure robust financing to bridge this gap between the initial $7.5M fleet spend and the ramp-up of corporate rental contracts. Survival depends on the depth of your capital reserves.
A rental car franchise revenue stream analysis shows that a 10% shift in premium rentals drastically alters your Year 1 margin. High-performance scenarios that maximize corporate contracts can improve the 1.72% IRR, while low-utilization periods will extend the payback period further. Scenarios prepare you for the reality that plans rarely go perfectly.
This rental car franchise financial model is built in Excel with open formulas, allowing you to swap out fleet counts or rental rates instantly. You can adjust the timing of your vehicle acquisitions or shift labor costs as you scale from a single lot to a multi-unit operation. Flexibility is the difference between a static guess and a live roadmap.

Map out your growth using this franchise financial projection spreadsheet that tracks revenue from $4.42M in year one to over $7.25M by year five. The model calculates how EBITDA grows from $2.01M as your fleet matures, ensuring you see the long-term impact of depreciation on your bottom line. Long-term visibility helps you spot the cash crunch before it hits.

Operating a premium brand means managing an 8% royalty and a 2% marketing fund contribution on every dollar earned. This tool captures these specific financial obligations so you can see the real economics of the unit after the franchisor takes their cut. Royalties are a top-line tax that demands high-volume execution.

Estimating how to calculate startup costs for a rental car franchise is the first step toward securing your territory. This model breaks down the $125,000 franchise fee, $450,000 in leasehold improvements, and the massive $7.5M initial fleet purchase into a clear rental car franchise equipment and labor cost breakdown. Knowing your floor is more important than dreaming about your ceiling.

We use automotive industry financial benchmarking to validate your operating expense forecast, setting fleet depreciation at 10% and maintenance at 2.5%. These benchmarks help you verify if your car rental business plan template is realistic or if your costs are defintely out of line with the market. Benchmarks keep your ego in check and your bank account balanced.


Simply purchase and download the financial model template, then access it instantly using Microsoft Excel or Google Sheets. No installation or technical expertise required-just open and start working.

Enter your business-specific numbers, including revenue projections, costs, and investment details. The pre-built formulas will automatically calculate financial insights, saving you time and effort.

Leverage the investor-ready format to confidently showcase your financial projections to banks, franchise representatives, or investors. Impress stakeholders with clear, data-driven insights and professional reports.

Leverage the investor-ready format to confidently present your projections to banks, franchise representatives, or investors.