
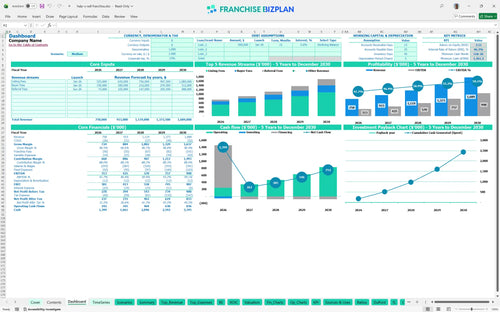
All-in-one Dashboard
Core inputs and core outputs


This franchise financial model template is a professional-grade Excel spreadsheet for franchise financial projections that integrates all your startup, operational, and growth data into one cohesive tool.
Core inputs and core outputs
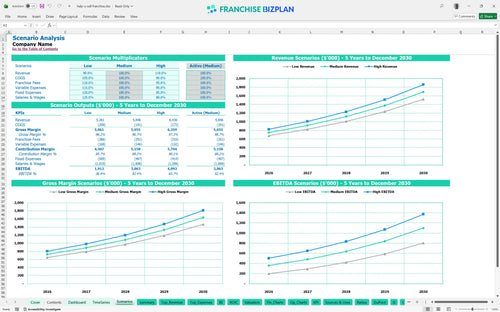
Three scenario analysis
Presentation ready
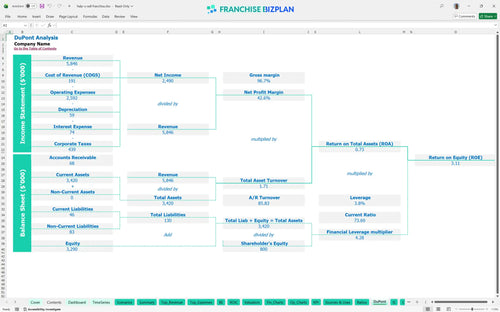
DuPont analysis
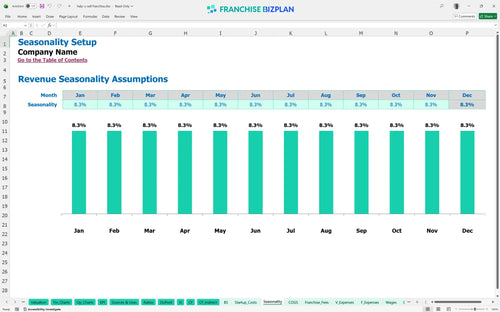
Researched revenue assumptions
Lender-friendly financial outputs
Revenue stream detailed view
Performance metrics benchmark
We developed this real estate brokerage business plan template using extensive research into set-fee brokerage operations. Key assumptions, such as the $350,000 year-one listing fee revenue and the $5,500 monthly rent, are pre-populated with researched data but remain fully editable for your specific location. Data-driven decisions start with clean assumptions.
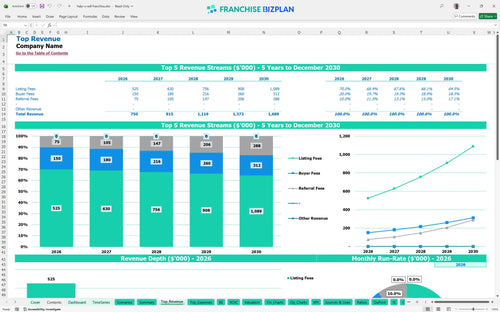
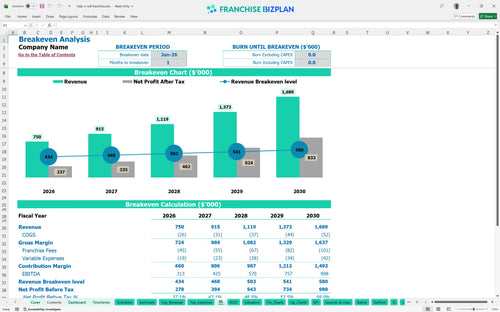
The model shows this franchise unit reaches its break-even date in January 2026, just one month after launch. With a projected year-one EBITDA of $313,000, the trajectory points toward immediate profitability driven by strong revenue stream forecasting for real estate brokerages. Speed to profit is the ultimate metric here.
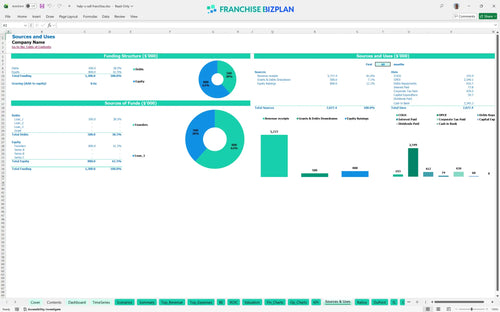
To launch this unit in the US, you need to know how to build a financial model for a real estate business that accounts for all $59,650 in startup capital. This includes the $17,750 franchise fee, $12,000 in office improvements, and $9,000 for computers and software. Cash is king, but knowing where it goes is queen.
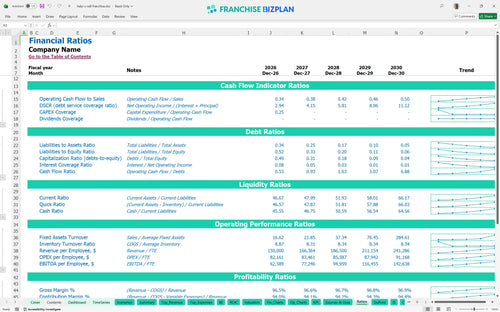
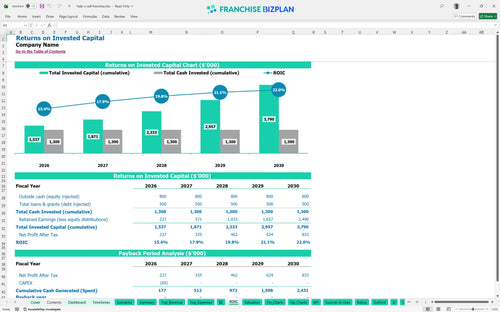
Evaluating financial performance of a real estate franchise through this model reveals an impressive internal rate of return (IRR) of 46.32%. While the investment return analysis indicates a payback period after year five, the scaling EBITDA reaching $998,000 by year five offers significant long-term value. High IRR makes the hard work worth it.
The monthly break-even point is achieved almost immediately because the $750,000 year-one revenue far exceeds the $12,450 in monthly fixed costs. Estimating overhead costs for a new franchise location shows that listing volume is the primary driver for maintaining this early stability. Volume is your best friend for hitting zero.
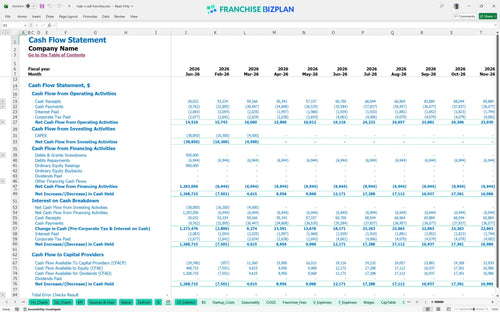
The lowest cash point occurs in February 2026 at $1,261,000, providing a substantial runway for the ramp-up period. This budget template for opening a new real estate franchise unit ensures you have a massive buffer to handle any delays in transaction closings. A big buffer means you sleep better at night.
Profitability analysis for set-fee real estate models shows that even in lower-volume scenarios, the high margins on listing fees keep the unit viable. Moving to a high-growth scenario with 4.0 FTE agents by year five dramatically increases year-one margins and peak cash potential. Planning for the worst helps you reach the best.
Finance: update unit break-even and payback model by Friday
This real estate franchise financial model is built entirely in Excel, giving you total control over every variable. It features pre-filled formulas and editable assumptions, making it one of the most flexible financial planning tools for prospective franchise owners looking to adapt the model to their specific territory and local market conditions. Every cell is open for your input.

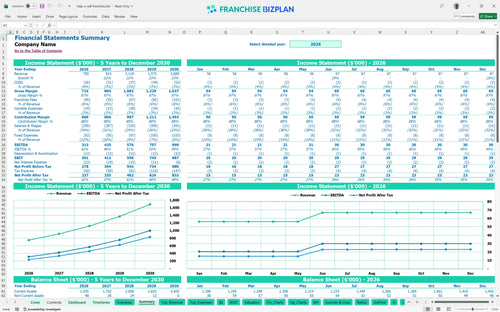
Planning for long-term growth requires a detailed roadmap, so this model provides a full 60-month outlook. It functions as a comprehensive financial model template for real estate franchise owners, offering deep dives into operating expense forecasting and cash flow management to ensure your brokerage scales sustainably. Five years of data beats five minutes of guessing.

The model accurately captures the specific franchise royalty structure, including the 6% royalty fee and the 0% marketing fund contribution. This level of detail is essential for a precise franchise unit profitability projection, as it shows exactly how much gross income remains after meeting your brand obligations. Royalties are a fixed reality, so plan for them.

Our franchise startup cost spreadsheet helps you map out the initial $59,650 investment, from the $17,750 franchise fee to office improvements. By identifying these costs early, you can run a precise break-even point calculation to see exactly when your listing volume will cover your monthly overhead. Knowing your zero-day is the best stress relief.

We have integrated industry-standard benchmarks for labor and occupancy to help you sanity-check your projections. You can defintely compare your $5,500 monthly rent and staffing costs against typical ranges to ensure your model remains realistic and competitive within the real estate sector. Don't fly blind when you can use proven data.


Simply purchase and download the financial model template, then access it instantly using Microsoft Excel or Google Sheets. No installation or technical expertise required-just open and start working.

Enter your business-specific numbers, including revenue projections, costs, and investment details. The pre-built formulas will automatically calculate financial insights, saving you time and effort.

Leverage the investor-ready format to confidently showcase your financial projections to banks, franchise representatives, or investors. Impress stakeholders with clear, data-driven insights and professional reports.

Leverage the investor-ready format to confidently present your projections to banks, franchise representatives, or investors.