
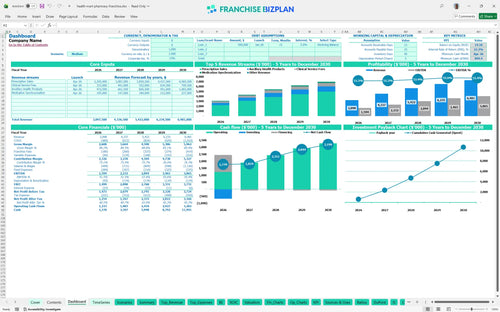
All-in-one Dashboard
Core inputs and core outputs


This comprehensive financial tool provides a data-driven roadmap for launching and scaling a high-volume pharmacy unit with integrated clinical services and compounding revenue streams.
Core inputs and core outputs
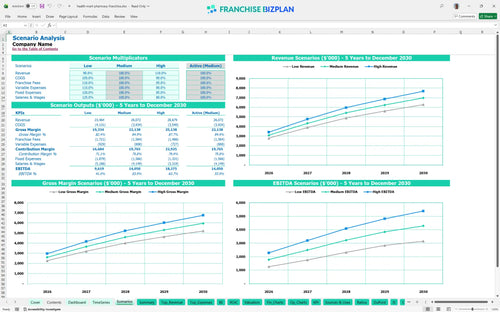
Three scenario analysis
Presentation ready
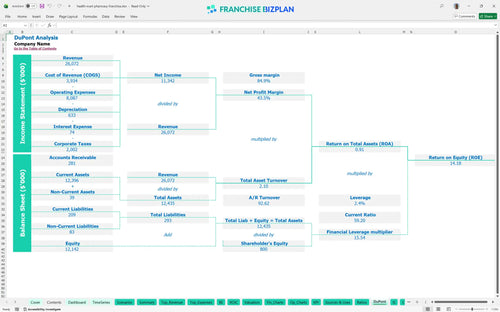
DuPont analysis
Researched revenue assumptions
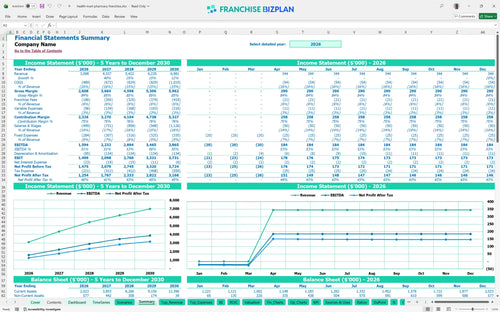
Lender-friendly financial outputs
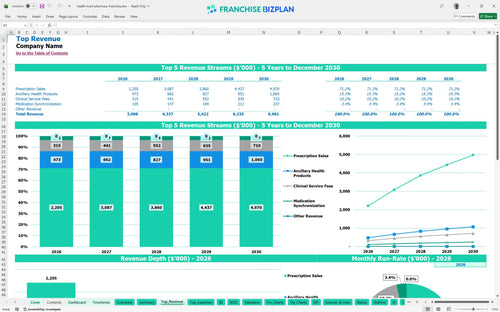
Revenue stream detailed view
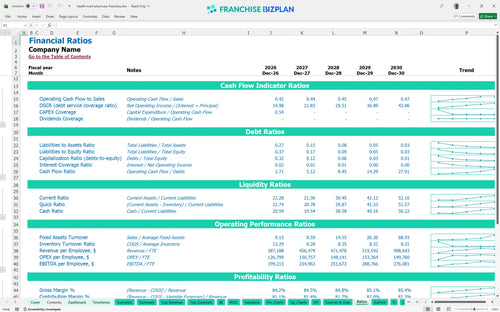
Performance metrics benchmark
We built this pharmacy franchise unit financial model using extensive research into the boutique healthcare sector and specialized compounding markets. Key assumptions like your $3.09M year-one revenue, $135k PIC salary, and the 5% royalty fee are pre-populated and fully editable to match your specific territory. This model ensures you are defintely prepared for the $1.59M EBITDA expected in your first full year of operations.
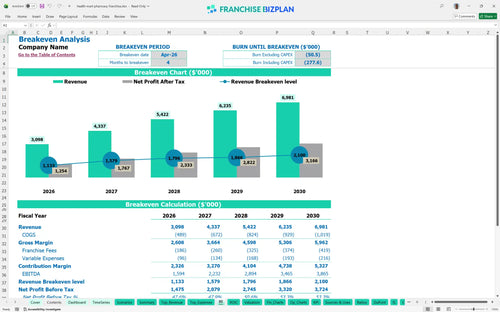
The pharmacy unit reaches profitability in April 2026, just four months after the January launch, driven by strong initial prescription sales of $1.47M. Net profit scales significantly as EBITDA grows from $1.59M in Year 1 to $3.86M in Year 5, even after accounting for 6% in total franchise fees.
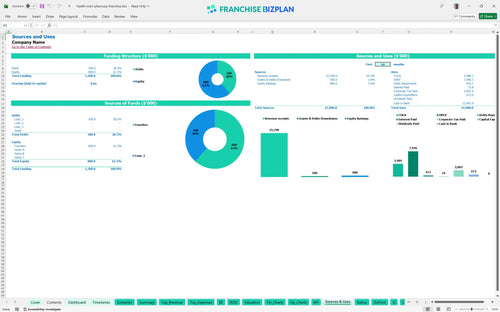
You will need approximately $672,000 in upfront capital for fixed assets plus a significant cash buffer to handle the $894,000 minimum cash need during the early ramp-up. This investment covers the $35,000 franchise fee, extensive leasehold improvements, and specialized compounding lab equipment to ensure clinical readiness from day one.
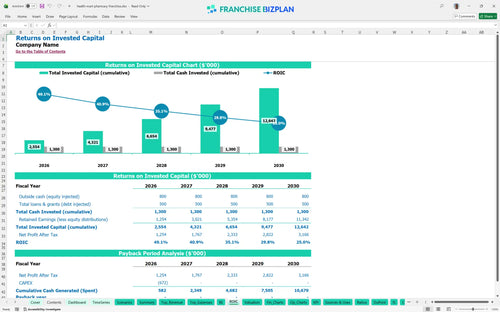
Investors can expect an Internal Rate of Return (IRR) of 22.18% and a Return on Equity (ROE) of 14.18% over the five-year forecast period. While the model shows the full payback occurs after year five, the high annual EBITDA margins suggest a very healthy cash-on-cash return once the initial debt or equity is serviced. Efficiency is the secret sauce for high returns.
The unit hits its monthly break-even point in April 2026, requiring about four months of operation to cover the $18,000 monthly rent and the $434,000 annual pharmacist payroll. The primary driver for reaching this point is the volume of prescription sales, which must hit the $1.47M annual run rate quickly to offset high fixed labor costs.
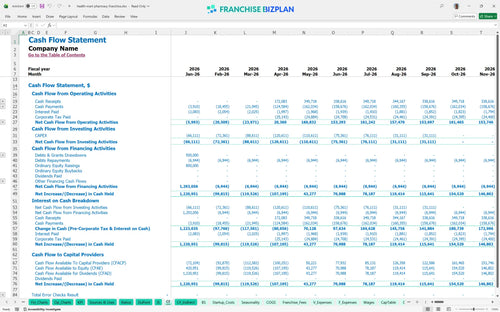
The lowest cash point occurs in April 2026 with a balance of $894,000, meaning you need a substantial liquidity cushion to survive the build-out and initial inventory load. This cash runway is protected by the high year-one EBITDA, but any delay in insurance reimbursements could tighten the squeeze. Cash is the oxygen of your pharmacy.
A High scenario, driven by superior clinical pharmacy consulting fees, can push Year 1 revenue well past the $3.09M mark and accelerate the 22.18% IRR. Conversely, a Low scenario with slower prescription growth would delay the April 2026 break-even and increase the peak cash need beyond the current $894,000 estimate. Scenario planning is about surviving the worst and preparing for the best.
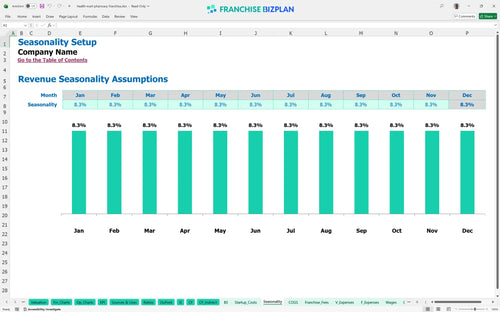
Maximizing the pharmacy medication synchronization revenue model is the most effective way to stabilize monthly cash flow and ensure recurring prescription volume. By focusing on pediatric compounding services and clinical pharmacy consulting, you differentiate from big-box competitors and capture higher-margin specialized care segments. This approach turns a standard retail pharmacy into a high-value community health destination.
Finance: update unit break-even and payback model by Friday
This pharmacy financial model template provides a flexible Excel environment where every formula and assumption is open for your specific adjustments. You can easily plug in your local rent, specific pharmacist salaries, and regional drug inventory costs to see how they impact your bottom line. It is designed to help you move from a generic independent pharmacy business plan to a precise, location-specific forecast in minutes. Every 1-point margin leak matters fast in a retail pharmacy, so having total control over the math is essential.

You need a long-term view to understand how scaling from $3.09 million in year one to nearly $7 million by year five changes your operational needs. This model tracks revenue, EBITDA, and cash flow over a 60-month period to ensure your pharmacy franchise investment analysis accounts for both the initial ramp-up and mature-unit performance. Seeing the leap from a $1.59 million EBITDA to $3.86 million helps you plan for future tax liabilities and reinvestment needs. Long-term success in this sector depends on managing the timing gaps between growth and cash collection.

Operating under a brand means you must account for the 5% royalty and 1% marketing fund contribution that come off the top of your gross sales. This model integrates these ongoing obligations directly into your monthly profit and loss statement, so you see the true store-level margin after the franchisor takes their cut. At $3.09 million in annual sales, that 6% total fee represents about $185,880 in annual costs before you pay a single employee. Understanding these fixed percentages is vital for maintaining a healthy pharmacy franchise profit and loss statement.

Estimating pharmacy franchise startup costs requires a deep dive into leasehold improvements and specialized equipment, which total over $672,000 in this model. We help you calculate the exact sales volume needed to cover your $18,000 monthly rent and high-level pharmacist salaries. With a breakeven date of April 2026, you can see how the first four months of operations will strain your capital before the unit begins to sustain itself. Knowing your break-even point helps you manage the early-stage anxiety of a new launch.

This model uses researched data for retail pharmacy operations, including drug inventory costs that start at 14% of revenue and scale down as your buying power improves. We include benchmarks for staffing, like a $135,000 Pharmacist in Charge salary, to ensure your projections are grounded in the current US labor market. Comparing your expected 22.18% IRR against industry averages allows you to sanity-check your boutique pharmacy business plan excel template. If your labor or inventory costs drift too far from these benchmarks, your store-level EBITDA will suffer defintely.


Simply purchase and download the financial model template, then access it instantly using Microsoft Excel or Google Sheets. No installation or technical expertise required-just open and start working.

Enter your business-specific numbers, including revenue projections, costs, and investment details. The pre-built formulas will automatically calculate financial insights, saving you time and effort.

Leverage the investor-ready format to confidently showcase your financial projections to banks, franchise representatives, or investors. Impress stakeholders with clear, data-driven insights and professional reports.

Leverage the investor-ready format to confidently present your projections to banks, franchise representatives, or investors.