
All-in-one Dashboard
Core inputs and core outputs


This franchise unit financial model template provides a comprehensive, data-driven framework for projecting five years of hotel performance, including detailed revenue streams, labor costs, and capital requirements.
Core inputs and core outputs
Three scenario analysis
Presentation ready
DuPont analysis
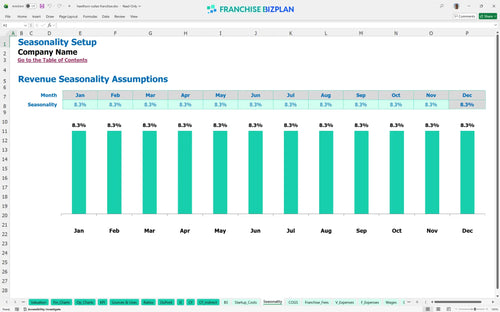
Researched revenue assumptions
Lender-friendly financial outputs
Revenue stream detailed view
Performance metrics benchmark
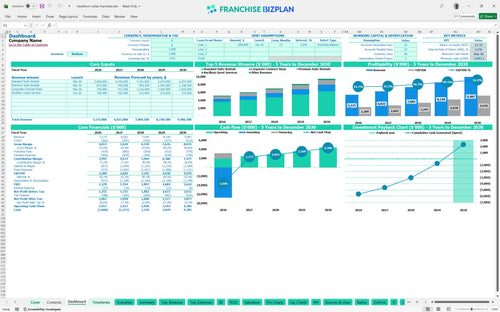
We built this extended stay hotel financial model using deep industry research to ensure every line item reflects the reality of the hospitality market. Key assumptions, including the $5.17 million year-one revenue target and the $2.2 million EBITDA projection, are pre-populated but defintely remain fully editable to match your specific location. This tool allows you to stress-test your business plan before you sign a lease or commit to a brand.
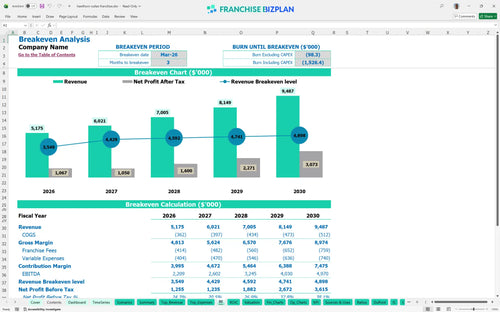
The model shows this unit reaches its break-even point in March 2026, just three months after launch. With a year-one EBITDA of $2.2 million, the operation quickly generates enough cash to cover its $45,000 monthly rent and significant labor overhead. Profitability in hospitality is won in the margins of labor and utilities.
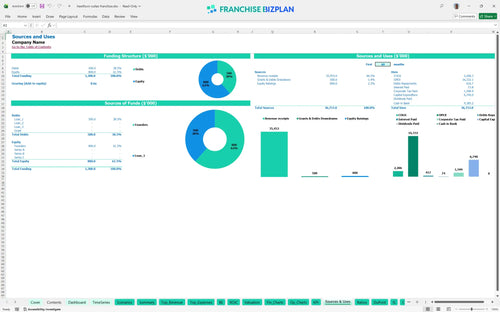
Launching this unit requires a total capital investment of approximately $6.74 million. This covers the $40,000 franchise fee, $3.5 million for leasehold improvements, and $1.2 million for suite furnishings to meet brand standards. You can't build a hotel on a shoestring budget.
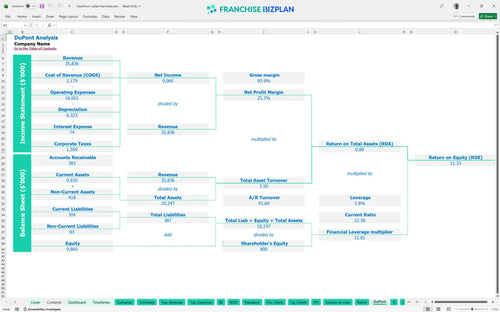
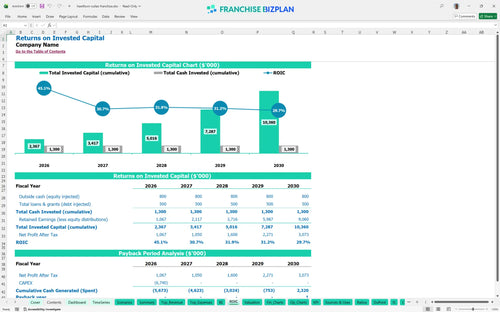
Investors can expect an Internal Rate of Return (IRR) of 3.1% and a Return on Equity (ROE) of 11.33% over the five-year period. The total payback period is estimated at 5 years, which is standard for a midscale hotel development of this size. Time is the most expensive variable in your ROI calculation.
The monthly break-even point is reached in month 3, driven primarily by the high average ticket of extended-stay rentals. Reaching this point depends on maintaining a strong mix of standard suite rentals and high-margin corporate contracts. Volume is vanity, but break-even is sanity.
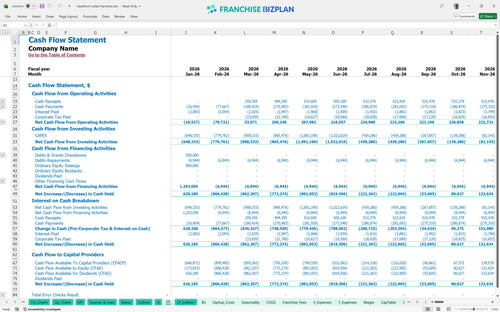
The model identifies a lowest cash point of negative $3.99 million in September 2026 during the initial ramp-up and CAPEX heavy phase. This highlights the need for a robust financing plan or cash reserve to bridge the gap until the unit reaches full occupancy. Cash is the oxygen of your hotel during the first year.
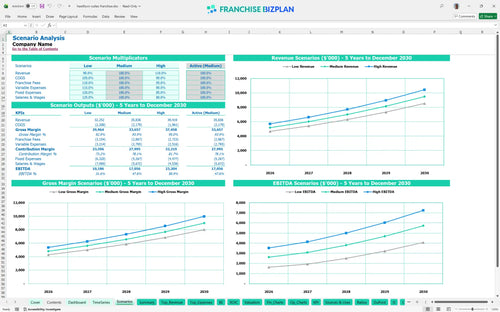
The model allows you to toggle between Low, Medium, and High scenarios to see how a 10% drop in RevPAR (Revenue Per Available Room) affects your ability to service debt. In the High case, accelerated corporate demand can push year-one revenue well beyond the $5.17 million baseline, significantly shortening the payback period. Planning for the worst makes the best case possible.
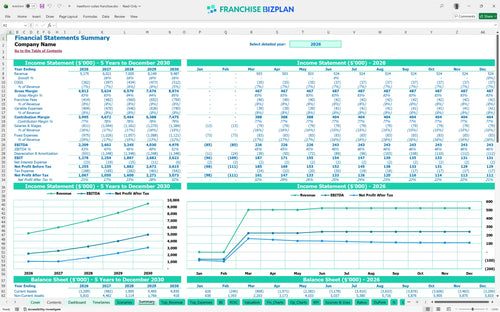
This hotel franchise financial model is built entirely in Excel, giving you full control over every assumption and formula. You can easily adjust room rates, occupancy targets, or labor costs to see how changes impact your bottom line in real time. It is designed to be a living document that grows with your business, whether you are looking at a single site or a multi-unit expansion. Every cell is open for your own data.

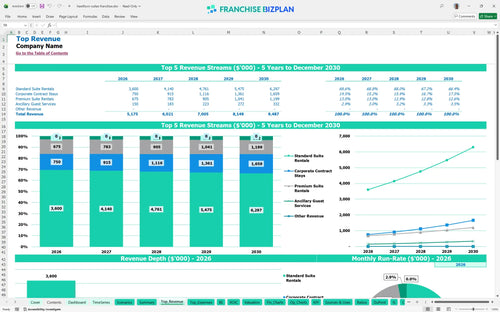
Planning for an extended stay hotel requires a long-term view of the market, which is why this model provides a detailed 5-year outlook. You can track revenue scaling from $5.17 million in year one to over $9.48 million by year five, allowing for precise capital expenditure planning. This long-term visibility helps you manage debt service and investor expectations with confidence. Long-term visibility is the only way to manage hospitality debt.

Operating under a major brand involves specific financial obligations that can squeeze margins if not managed correctly. This model specifically tracks the 5.5% royalty fee and 2.5% marketing fund contribution, ensuring these costs are baked into your monthly cash flow. By accounting for these brand-level expenses upfront, you get a realistic view of your store-level EBITDA. Fees are the price of admission for brand-driven demand.

The model provides a clear breakdown of the initial investment required to get your doors open, from the $40,000 franchise fee to the $3.5 million in leasehold improvements. It includes a detailed break-even analysis so you know exactly when your monthly revenue will cover both fixed and variable costs. This helps you avoid the common trap of under-capitalization during the ramp-up phase. Knowing your zero-day is better than guessing your payday.

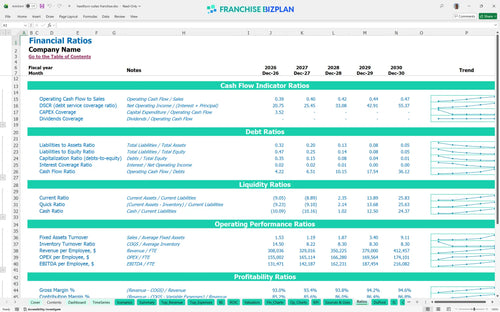
We have integrated hospitality industry standards into the model to help you sanity-check your operating assumptions against real-world performance. Whether you are looking at laundry costs at 2.8% of revenue or front desk staffing levels, the model helps you identify if your projections are too aggressive or conservative. This ensures your business plan holds up under scrutiny from lenders and partners. Benchmarks keep your projections grounded in reality.


Simply purchase and download the financial model template, then access it instantly using Microsoft Excel or Google Sheets. No installation or technical expertise required-just open and start working.

Enter your business-specific numbers, including revenue projections, costs, and investment details. The pre-built formulas will automatically calculate financial insights, saving you time and effort.

Leverage the investor-ready format to confidently showcase your financial projections to banks, franchise representatives, or investors. Impress stakeholders with clear, data-driven insights and professional reports.

Leverage the investor-ready format to confidently present your projections to banks, franchise representatives, or investors.