
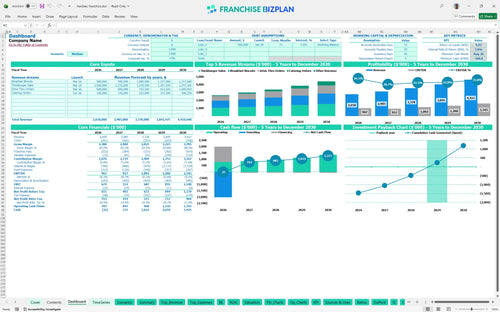
All-in-one Dashboard
Core inputs and core outputs


This comprehensive package includes a dynamic Excel dashboard, detailed P&L statements, and a full startup cost breakdown designed for professional franchise analysis.
Core inputs and core outputs
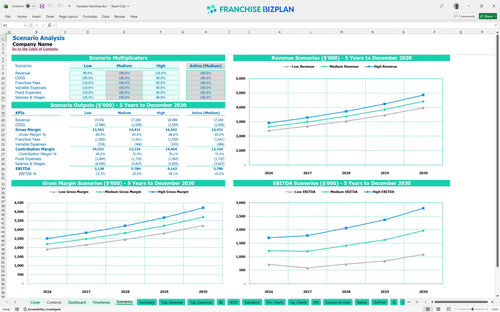
Three scenario analysis
Presentation ready
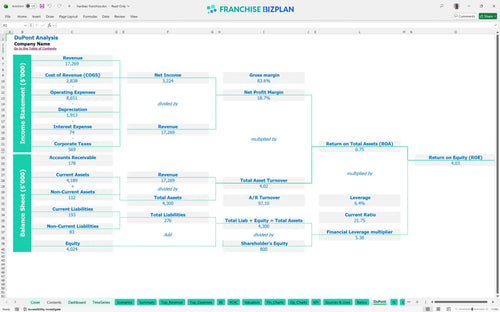
DuPont analysis
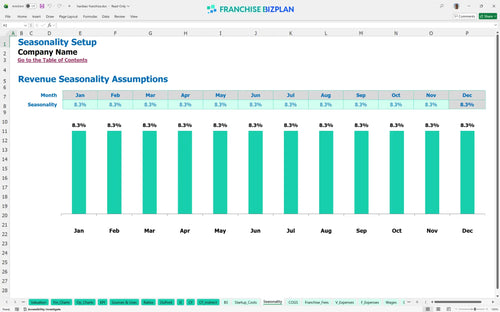
Researched revenue assumptions
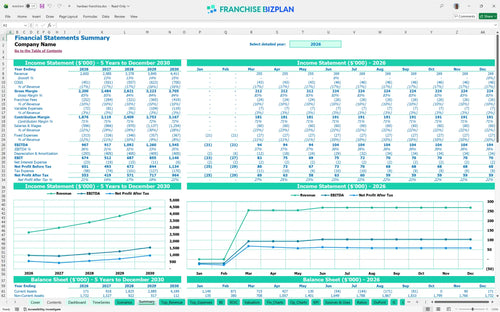
Lender-friendly financial outputs
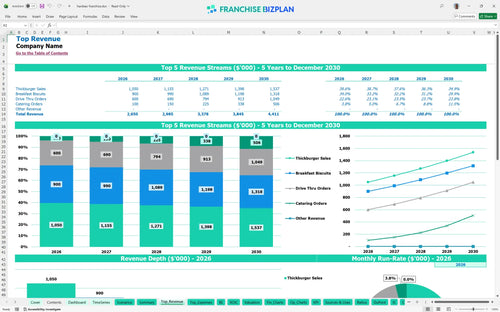
Revenue stream detailed view
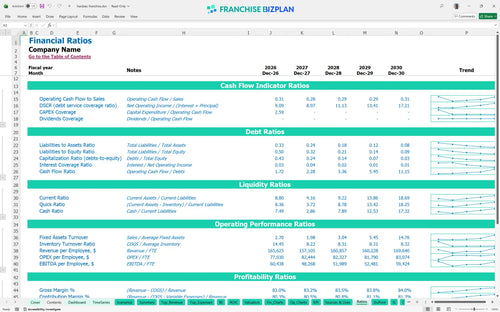
Performance metrics benchmark
We developed this fast food franchise financial model using deep-dive research into high-volume burger concepts and quick-service operations. Key assumptions like the $2.65 million year-one revenue target, $18,000 monthly rent, and the 9.5% total brand fees are pre-loaded and ready for your specific site data. This tool ensures your franchise investment financial projections are grounded in reality.
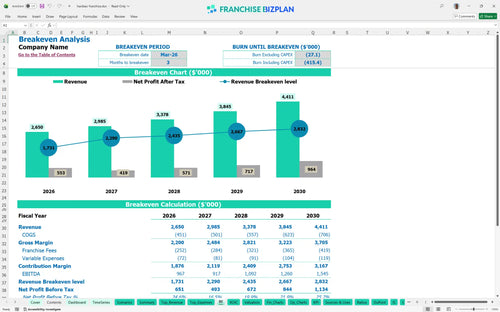
This franchise unit reaches its break-even point in March 2026, just three months after the initial launch. By year five, you are projected to generate $1.54 million in annual EBITDA after accounting for all food costs, $18,000 monthly rent, and brand royalties. Speed to profit is the only metric that matters early on.
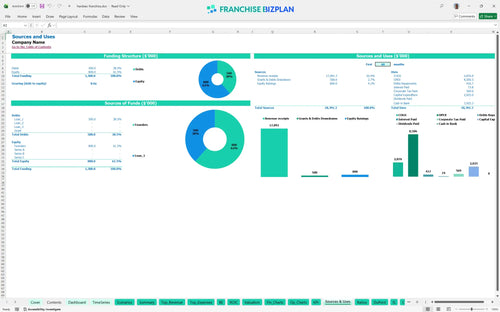
You need a total initial investment of $2,025,000 to get the doors open and the drive-thru running. This covers the $25,000 initial fee, $900,000 for leasehold improvements, and $400,000 for kitchen equipment. Capital allocation is about more than just equipment.
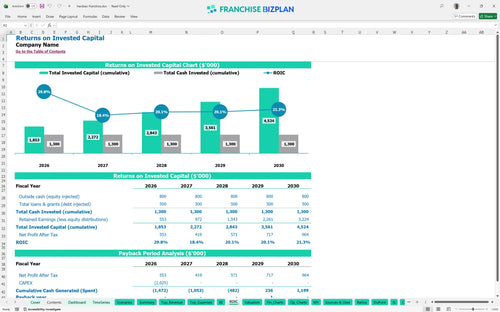
Investors can expect a 4-year payback period with an internal rate of return (IRR) of 3.8%. While the initial return on equity (ROE) is 4.03%, the long-term value is driven by the steady climb to $4.4 million in annual revenue. Real wealth in franchising is built on the exit multiple.
The unit reaches monthly break-even in March 2026, requiring approximately $220,000 in monthly sales to cover fixed costs like the $18,000 rent and $2,700 in total insurance. The primary driver for hitting this target is the $700,000 in first-year burger sales. Break-even is the first major milestone of your journey.
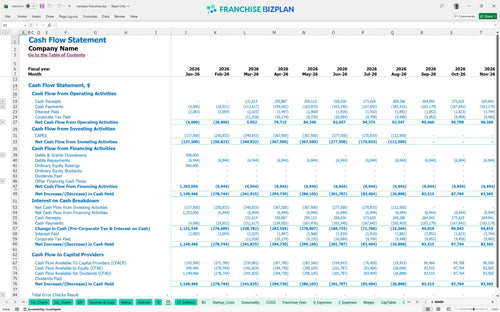
The lowest cash point occurs in August 2026, with a deficit of $368,000 during the initial ramp-up phase. You need enough working capital to bridge the gap between your $2 million build-out and the point where monthly cash flow turns positive. Cash is oxygen during the first twelve months.
Moving to a High scenario-driven by better local marketing-can significantly shorten that 4-year payback. If revenue drops 10% in a Low case, the $368,000 cash hole deepens, potentially pushing the break-even date past March 2026. Planning for the worst helps you achieve the best.
Finance: update unit break-even and payback model by Friday.
This Excel-based tool lets you swap out every assumption to match your specific territory and local market conditions. You can adjust the $18,000 monthly rent or shift the 15% food cost targets as local prices fluctuate throughout the year. It is built for operators who need to see how a 1% change in drive-thru speed or labor efficiency impacts the bottom line. Every cell is open for your local market adjustments.

Map out your journey from a $2.65 million opening year to a mature $4.41 million operation by your fifth year of business. This model tracks how EBITDA (earnings before interest, taxes, depreciation, and amortization) scales as you add crew members and grow your catering revenue. It defintely helps you visualize the long-term cash flow needed to sustain a high-volume quick-service site. Long-term vision requires tracking cash, not just sales.

Calculate exactly how much goes back to the brand with built-in 4% royalty and 5.5% marketing fund calculations. At $3.37 million in year three revenue, these fees total over $320,000 annually, making them a significant part of your cost structure. Understanding these off-the-top costs is critical for protecting your store-level margin. Royalties are your biggest fixed-percentage hurdle.

Budgeting for a $2.02 million total investment requires precision, especially with $900,000 earmarked for leasehold improvements alone. This fast food startup cost calculator shows you need to hit your break-even point by month three to keep your working capital intact. It maps out every dollar from the $25,000 franchise fee to the $120,000 POS system. Know your number before you sign the lease.

Compare your $32,000 average crew member salary and 15% food cost assumptions against standard quick service restaurant financial modeling guide metrics. If your labor or COGS (cost of goods sold) drift too far from these benchmarks, the model flags the risk to your 4-year payback period. Benchmarks keep your projections from becoming fiction.


Simply purchase and download the financial model template, then access it instantly using Microsoft Excel or Google Sheets. No installation or technical expertise required-just open and start working.

Enter your business-specific numbers, including revenue projections, costs, and investment details. The pre-built formulas will automatically calculate financial insights, saving you time and effort.

Leverage the investor-ready format to confidently showcase your financial projections to banks, franchise representatives, or investors. Impress stakeholders with clear, data-driven insights and professional reports.

Leverage the investor-ready format to confidently present your projections to banks, franchise representatives, or investors.