


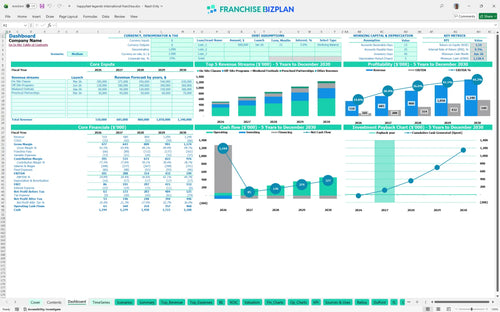
All-in-one Dashboard
Core inputs and core outputs



This Excel template for managing franchise unit revenue streams provides a complete five-year picture of your sports business from initial fee to mature-unit cash flow.
Core inputs and core outputs
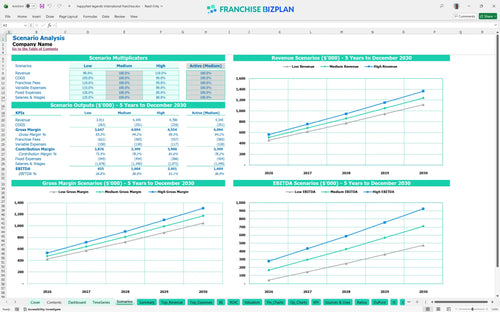
Three scenario analysis
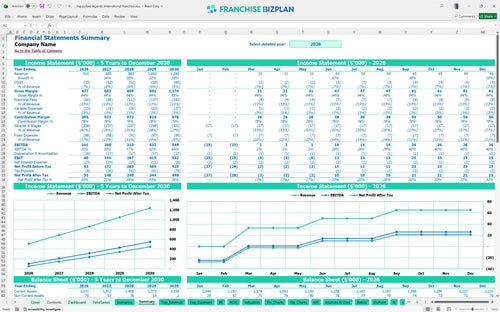
Presentation ready

DuPont analysis
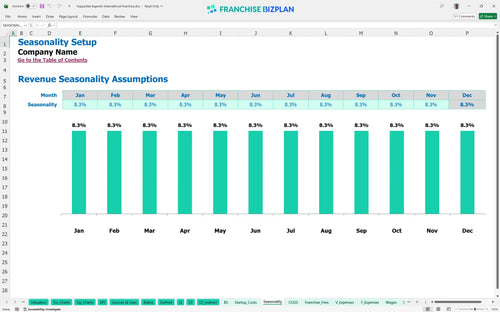
Researched revenue assumptions

Lender-friendly financial outputs

Revenue stream detailed view
Performance metrics benchmark
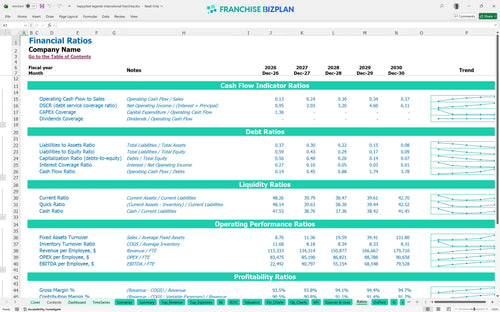
We built this children's sports franchise business plan using deep research into youth enrichment economics and mobile coaching operations. The model comes pre-populated with specific revenue streams like on-site classes and off-site programs, alongside a full staffing plan for coaches and managers. With a year one revenue target of $510,000 and a 10% royalty structure already baked in, you can start testing your local market assumptions immediately.
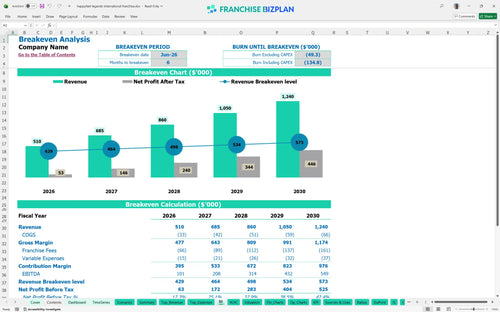
The unit reaches youth enrichment franchise profitability by June 2026, just six months after launching. With year one EBITDA starting at $101,000 and climbing to $549,000 by year five, the model shows a clear path to scaling net income as you add more off-site programs. Profit follows the whistle.
You need to know how to calculate startup costs for a kids' sports franchise to avoid mid-launch cash crunches. The total initial investment includes a $35,000 franchise fee, $12,000 for soccer equipment, and $10,000 for facility improvements, plus a significant cash buffer of $1,128,000 for operations. Capital is the fuel for your coaching engine.
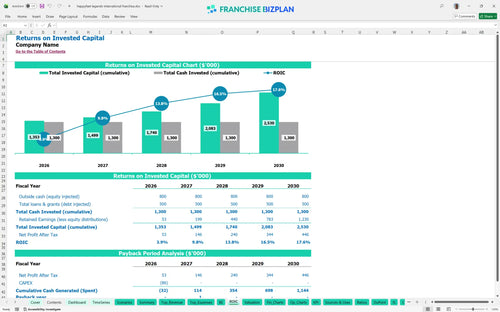
When evaluating franchise investment risk for sports businesses, the metrics tell the story: this model shows a 9.3% IRR and a 1.54 return on equity. You can expect a full payback of your initial capital within 2 years, which is strong for a service-based enrichment model. Speed to payback is the ultimate de-risking tool.
Estimating profitability for youth athletic franchises requires hitting the monthly break-even by June 2026. This is primarily driven by managing the $3,800 monthly lease and the 13% combined royalty and marketing burden against your $200,000 initial on-site class revenue. Volume is the fastest way to cover fixed costs.
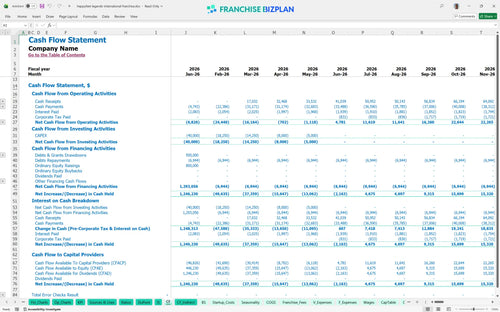
The lowest cash point occurs in June 2026, coinciding with your break-even month, so your cash flow forecasting needs to be tight during the first 180 days. With a minimum cash requirement of $1,128,000, you have a massive buffer to handle any delays in signing up new corporate daycare contracts. Buffer is the difference between stress and success.
The model provides financial projections for preschool enrichment programs across low, medium, and high cases to show how a 10% dip in enrollment affects your $101,000 year-one EBITDA. In the high case, faster adoption of weekend festivals and off-site programs can significantly pull forward your 2-year payback period. Always plan for the worst but execute for the best.
Finance: update unit break-even and payback model by Friday.
This franchise unit financial spreadsheet for beginners is fully defintely editable in Excel, allowing you to swap out our researched assumptions for your specific territory reality. You can adjust the pre-filled formulas to match your local labor market or specific lease terms without breaking the logic. It is a plug-and-play tool designed to handle the heavy lifting of financial modeling so you can focus on the actual business. One tweak to your class capacity changes everything in real-time.

Planning for the long haul requires more than just a first-year guess, so we built detailed franchise unit financial projections covering a full sixty-month period. You can track how revenue scales from $510,000 in year one to over $1.2 million by year five as your local density improves. This view helps you see the transition from a hands-on owner-operator to a multi-unit manager. Growth is a marathon, not a sprint.

Understanding how to analyze franchise royalty and marketing fees is critical because these off-the-top costs directly impact your take-home pay. This model accounts for a 10% royalty and a 3% marketing fee, ensuring you see the net impact on your store-level EBITDA. We map these against your $510,000 base revenue so there are no surprises when the franchisor drafts their payment. Fees are the price of brand power.

Our franchise startup cost calculator breaks down the initial $35,000 fee and subsequent capital outlays like the $12,000 for soccer equipment and $10,000 for facility improvements. By mapping these against your fixed monthly costs, like the $3,800 community center lease, you can pinpoint exactly when the unit stops burning cash. Knowing your nut is the first step to sleeping better at night.

We use best practices for franchise financial forecasting by including built-in benchmarks for labor and occupancy to keep your plan grounded in reality. If your coaching wages for the four soccer coaches deviate too far from the $30,000 annual average, the model helps you spot the inefficiency early. Use these numbers to sanity-check your local operating plan against the wider chain. Data beats intuition every single time.


Simply purchase and download the financial model template, then access it instantly using Microsoft Excel or Google Sheets. No installation or technical expertise required-just open and start working.

Enter your business-specific numbers, including revenue projections, costs, and investment details. The pre-built formulas will automatically calculate financial insights, saving you time and effort.

Leverage the investor-ready format to confidently showcase your financial projections to banks, franchise representatives, or investors. Impress stakeholders with clear, data-driven insights and professional reports.

Leverage the investor-ready format to confidently present your projections to banks, franchise representatives, or investors.