


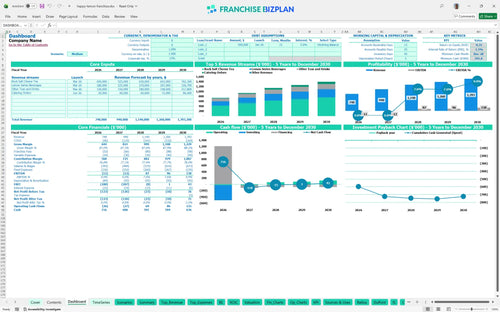
All-in-one Dashboard
Core inputs and core outputs



This comprehensive Excel template for franchise unit financial forecasting includes pre-built tabs for revenue modeling, staffing plans, CAPEX (capital expenditures) scheduling, and full 5-year financial statements tailored for a high-volume beverage unit.
Core inputs and core outputs
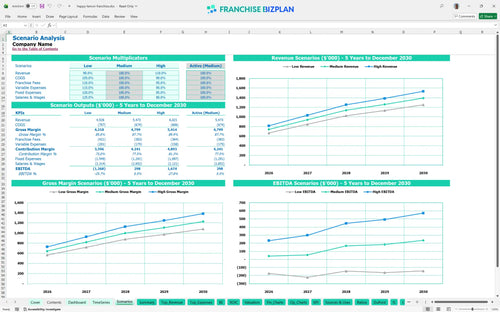
Three scenario analysis
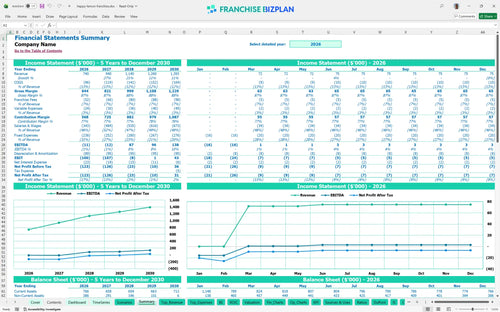
Presentation ready
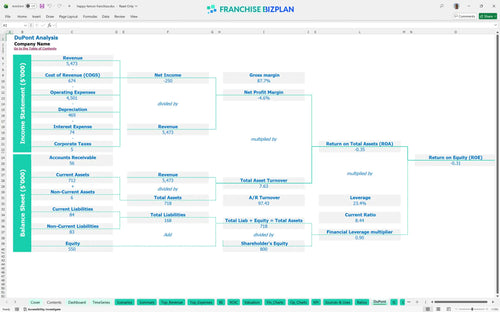
DuPont analysis
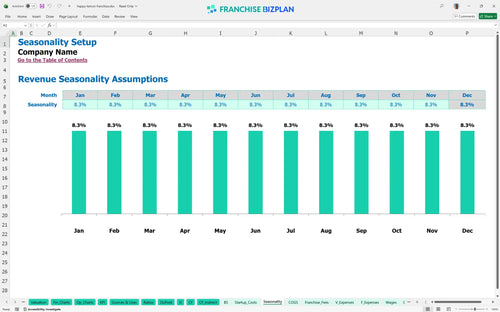
Researched revenue assumptions
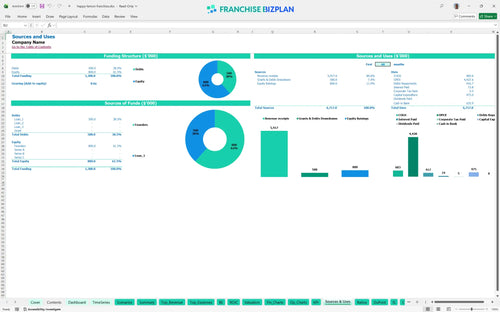
Lender-friendly financial outputs
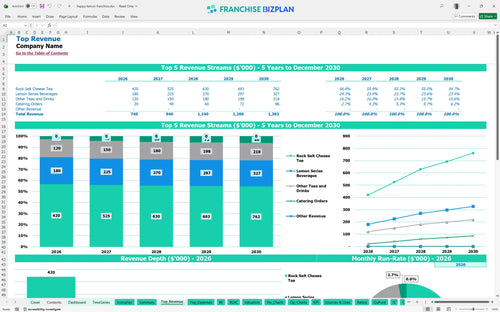
Revenue stream detailed view
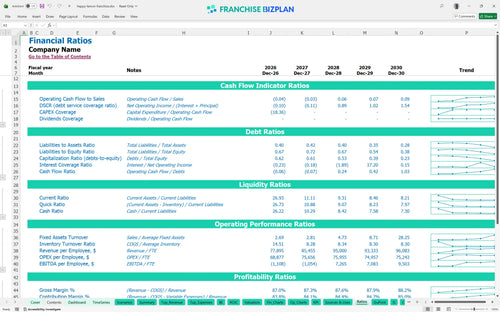
Performance metrics benchmark
We developed this Happy Lemon Franchise franchise unit financial model using detailed market research on high-traffic campus locations and premium tea operations. The assumptions for revenue streams like Rock Salt Cheese Tea, operating expenses, and franchise royalty fees are pre-populated but fully editable to match your specific territory. This model is defintely the best way to start estimating revenue for a campus beverage kiosk while accounting for the $740,000 Year 1 sales target and the $14,000 monthly rent burden.
Based on the researched data, this unit is projected to reach positive EBITDA (earnings before interest, taxes, depreciation, and amortization) in Year 3, hitting approximately $87,000. While Year 1 and Year 2 show slight losses of $11,000 and $12,000 respectively, the franchise unit profitability analysis shows a strong upward trajectory as revenue climbs toward $1.14M in the third year. Factors affecting bubble tea shop profitability like ingredient waste and labor efficiency are the primary drivers here.
You will need approximately $475,000 in initial capital expenditure planning to get the doors open, plus a working capital buffer. This total includes the $30,000 initial franchise fee and a significant $220,000 investment in leasehold improvements to meet brand standards for an open-concept store. When learning how to calculate startup costs for a tea franchise, you must also account for $95,000 in specialized beverage equipment and $20,000 for initial inventory.
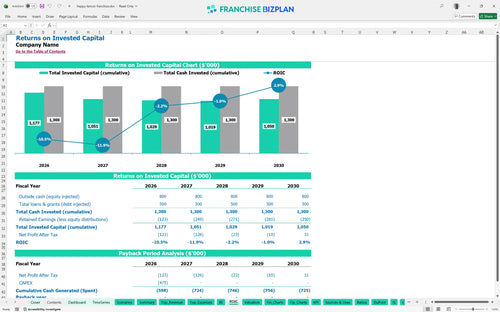
The ROI calculation for this unit shows an IRR (internal rate of return) of -1.46% over the initial five-year period, with a full payback occurring after Year 5. This reflects the high initial build-out costs of a flagship location and the ramp-up time required to reach $1.39M in annual sales. Analyzing franchise unit performance metrics suggests that long-term value sits in the steady cash flow growth, with EBITDA reaching $138,000 by the fifth year of operation.
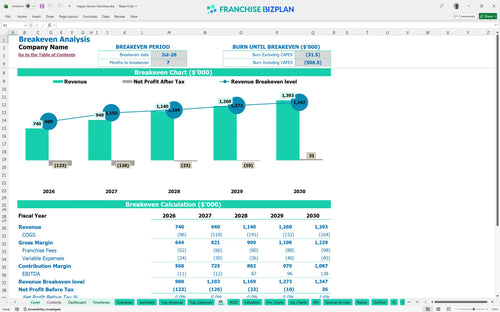
The unit is projected to reach its monthly break-even point in July 2026, roughly 7 months after opening. Calculating break-even point for a beverage franchise depends heavily on managing the $14,000 monthly rent and the 7% combined royalty and marketing fee. To stay above water, you must maintain a consistent daily volume of Rock Salt Cheese Tea and Lemon series drinks to cover these high fixed occupancy costs.
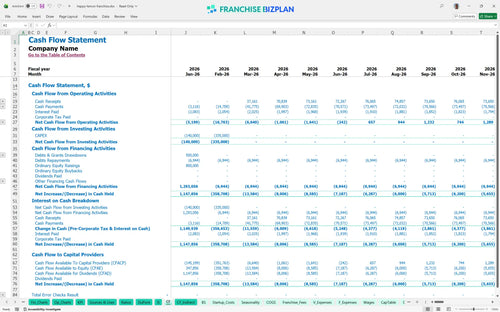
The lowest cash point is projected at $591,000 in December 2028, suggesting you need a substantial liquidity cushion to navigate the early years of growth. This operational expense spreadsheet for franchise owners tracks how the $14,000 rent and $2,200 utility bills impact your monthly runway during the ramp-up phase. If sales growth lags by even 10%, the pressure on your working capital will increase significantly before the unit reaches maturity.
This franchise investment feasibility study template allows you to compare Low, Medium, and High scenarios to see how a 10% drop in traffic affects your payback timing. In a high-performance scenario, reaching $1.39M in revenue earlier can shift the IRR into positive territory and accelerate the break-even date. Conversely, the low scenario highlights the risk of the $14,000 rent becoming a permanent drag if local marketing execution fails to capture the campus demographic.
Finance: update unit break-even and payback model by Friday.
This franchise financial model template is built in Excel with fully editable formulas and assumptions, allowing you to swap out numbers as your site selection or local labor market dictates. You can adjust every driver from hourly wages to beverage mix, making it easy to adapt the tool for a specific retail location or a multi-unit rollout. It is a practical franchise business plan Excel tool designed for real-world operators who need to move beyond static PDFs.

Success in the beverage space requires looking past the grand opening to understand long-term food service unit economics. This beverage franchise financial projection provides a detailed 5-year view of your income statement, cash flow, and balance sheet to help you plan for equipment replacement and debt service. It is a comprehensive financial model for new franchise location planning that maps out how annual unit sales, starting at $740,000 in Year 1, grow toward $1.39M by Year 5.

The model specifically handles the recurring franchise royalty fees and brand marketing contributions that eat into your store-level margin. By automating the 6% royalty and 1% marketing fund calculations, you can see exactly how much cash leaves the business before you pay your own bills. This ensures your projections reflect the true cost of the brand license and proprietary recipes without any hidden surprises in your monthly overhead.

Calculating bubble tea franchise startup costs requires a granular look at everything from leasehold improvements to initial inventory setup. This tool helps you build a complete startup budget for a retail beverage business, identifying the exact sales volume needed to cover your $14,000 monthly rent and fixed utilities. You will know the precise moment your unit stops burning cash and starts contributing to your bank account.

We have integrated standard food service unit economics into the model so you can sanity-check your beverage ingredients and packaging costs against industry norms. If your COGS (cost of goods sold) or labor percentages drift too far from the 13% and 28% benchmarks, the model highlights the gap so you can adjust your staffing or portion controls. This feature is vital for any franchise investment feasibility study template to ensure your plan is grounded in reality.


Simply purchase and download the financial model template, then access it instantly using Microsoft Excel or Google Sheets. No installation or technical expertise required-just open and start working.

Enter your business-specific numbers, including revenue projections, costs, and investment details. The pre-built formulas will automatically calculate financial insights, saving you time and effort.

Leverage the investor-ready format to confidently showcase your financial projections to banks, franchise representatives, or investors. Impress stakeholders with clear, data-driven insights and professional reports.

Leverage the investor-ready format to confidently present your projections to banks, franchise representatives, or investors.