
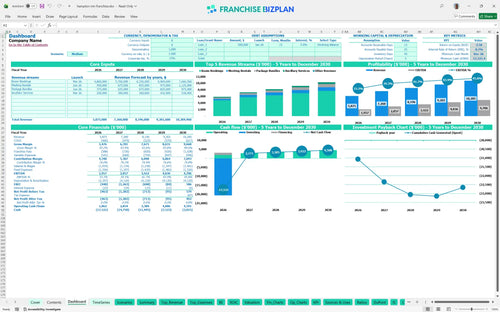
All-in-one Dashboard
Core inputs and core outputs


The franchise unit financial model provides a complete toolkit for estimating annual revenue for hotel franchise operations, covering everything from construction draws to multi-year EBITDA growth.
Core inputs and core outputs
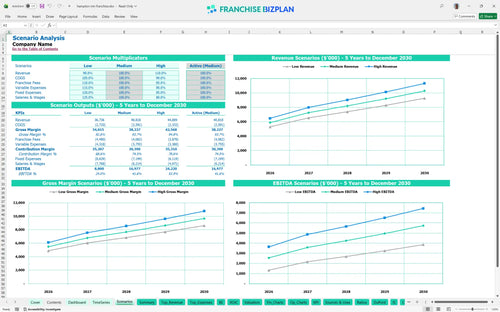
Three scenario analysis
Presentation ready
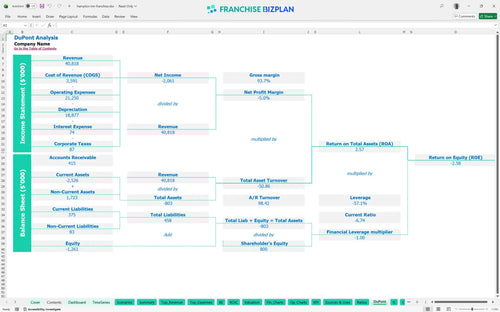
DuPont analysis
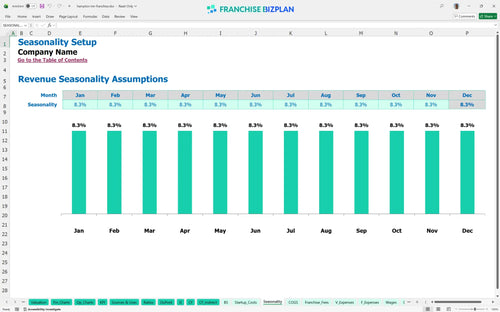
Researched revenue assumptions
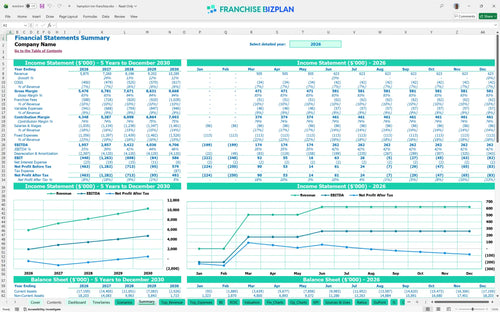
Lender-friendly financial outputs
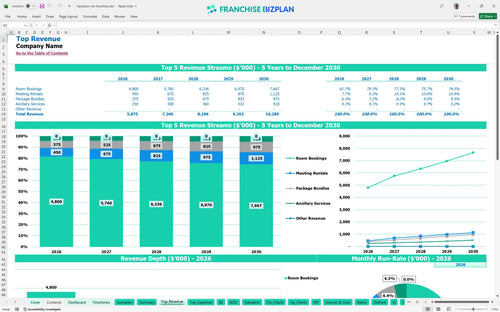
Revenue stream detailed view
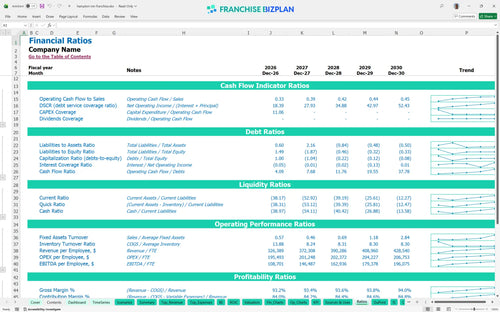
Performance metrics benchmark
We built this franchise unit financial model using intensive market research to ensure your hotel feasibility study is grounded in reality. Key assumptions like the $5.87M year-one revenue and the 6% royalty structure are pre-populated and fully editable to match your specific site selection and capital expenditure planning needs.
The unit achieves an EBITDA of $1.95M in its first year, scaling to $4.7M by year five as room bookings and meeting rentals mature. While operational cash flow is strong, the high initial capital expenditure means net profitability after all debt and depreciation is a long-term play.
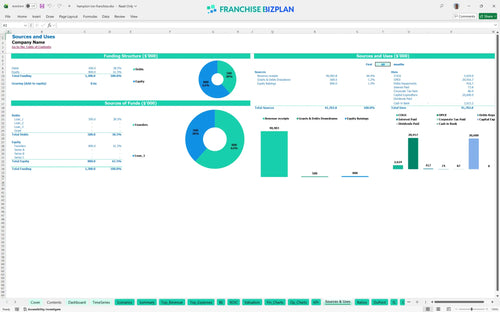
Launching this unit requires over $20 million in total investment, dominated by $12.5M for building construction and $2.8M for FF&E. You will defintely need to account for the $100,000 franchise fee and $1.2M in site development before the March 2026 launch date.
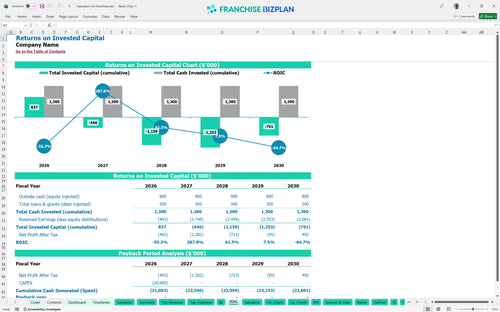
The ROI analysis for mid-scale hotel investment shows a -0.69% IRR and a -2.58% ROE over the five-year forecast period. Because the payback period extends beyond year five, this model is best suited for investors focused on long-term asset appreciation and stabilized EBITDA growth.
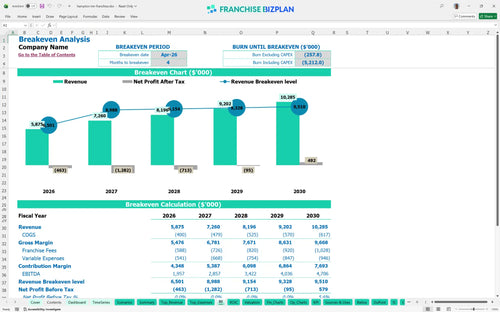
Operational break-even occurs in April 2026, just four months after the start of the year, driven by the $3.2M room booking forecast. The primary hurdle is the $45,000 monthly property lease and $28,000 in utilities, which require consistent occupancy to cover.
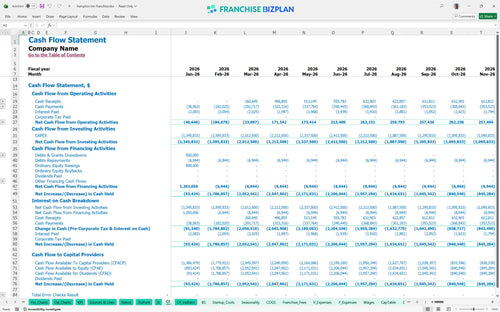
The lowest cash point hits -$17.52M in December 2026, reflecting the massive cash outflow for construction before the revenue streams fully ramp up. You must secure a robust construction loan and working capital buffer to navigate this intensive capital expenditure planning phase.
High scenarios driven by financial forecasting for hotel corporate retreats can significantly improve the year-one $1.95M EBITDA. Conversely, a low scenario where room bookings lag by 10% will delay the four-month break-even and deepen the peak cash need during the ramp-up.
This hotel franchise financial model is built in Excel, allowing you to swap out every assumption from room rates to local tax percentages. It uses pre-filled formulas so you can test how different occupancy levels or seasonal spikes in Scottsdale affect your bottom line without breaking the sheet.

Planning a mid-scale hotel investment requires looking past the grand opening to see how the asset matures over half a decade. This hotel financial projection spreadsheet maps out five years of revenue growth, from an initial $5.87M to over $10.28M, giving you a clear view of how escalating labor and maintenance costs impact your long-term cash flow.

Managing the brand relationship means budgeting for hotel franchise royalty fees and marketing contributions that total 10% of your top line. Our model tracks these ongoing obligations alongside the initial $100,000 entry fee, ensuring you see the exact dollar amount leaving the business before you pay your own mortgage or staff.

Understanding how to calculate startup costs for a hotel franchise is the first step toward securing financing. With a massive $12.5M construction budget and $2.8M for furniture and fixtures (FF&E), this template identifies the exact sales volume needed to cover your $45,000 monthly lease and other fixed burdens.

We integrated hospitality revenue management standards to help you verify if your 8% OTA commission or 4.8% breakfast cost is realistic for your market. These benchmarks let you compare your projected store-level margins against industry averages to ensure your hotel franchise unit profit and loss template isn't overly optimistic.


Simply purchase and download the financial model template, then access it instantly using Microsoft Excel or Google Sheets. No installation or technical expertise required-just open and start working.

Enter your business-specific numbers, including revenue projections, costs, and investment details. The pre-built formulas will automatically calculate financial insights, saving you time and effort.

Leverage the investor-ready format to confidently showcase your financial projections to banks, franchise representatives, or investors. Impress stakeholders with clear, data-driven insights and professional reports.

Leverage the investor-ready format to confidently present your projections to banks, franchise representatives, or investors.