
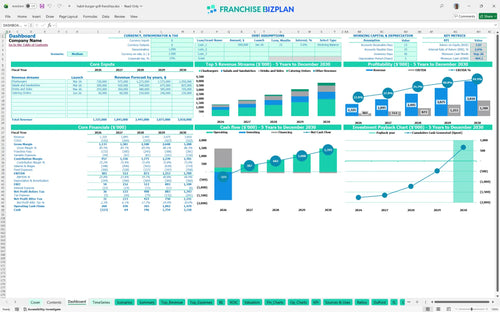
All-in-one Dashboard
Core inputs and core outputs


This comprehensive financial tool provides a complete roadmap for planning, launching, and scaling a high-volume burger franchise unit with precision.
Core inputs and core outputs
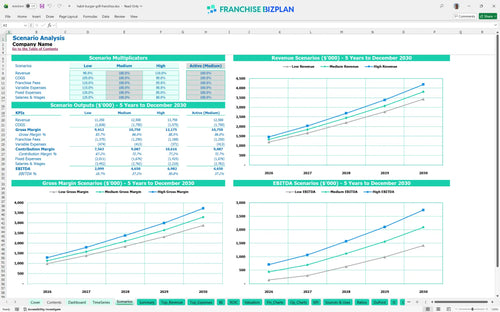
Three scenario analysis
Presentation ready
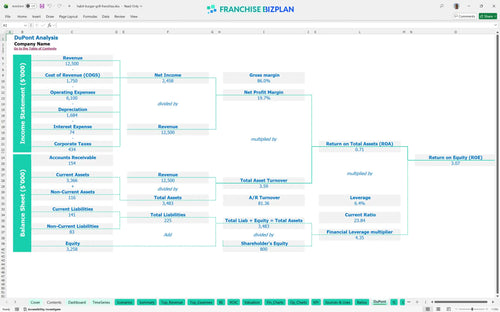
DuPont analysis
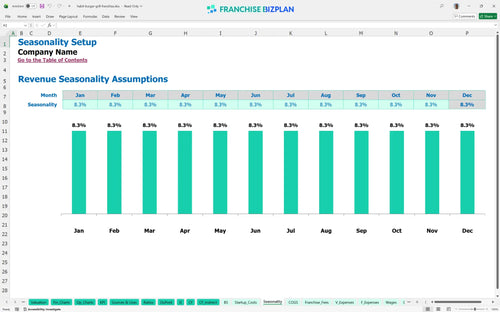
Researched revenue assumptions
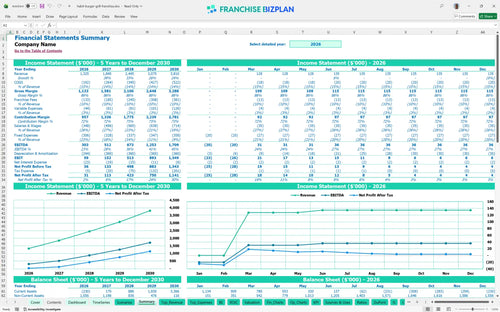
Lender-friendly financial outputs
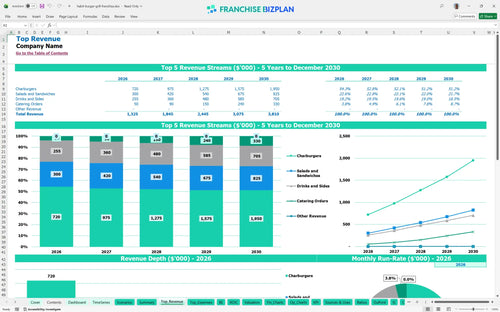
Revenue stream detailed view
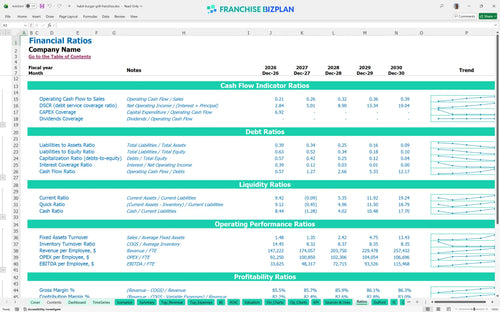
Performance metrics benchmark
We developed this financial model template for fast casual restaurant operators based on detailed research into high-volume burger concepts and franchise unit economics. The model comes pre-loaded with a $1.8M total investment and targets $1,325,000 in year-one revenue, but you can defintely edit every assumption to match your specific territory. It is designed to help you stress-test your local demand against a 5-year growth plan that reaches $3.8M in annual sales.
The unit hits an EBITDA of $303,000 in its first year and climbs to $1.7M by year five as revenue scales. Profitability depends on estimating labor and food costs for new franchise units accurately, with food costs starting at 13% and decreasing slightly as you gain purchasing power.
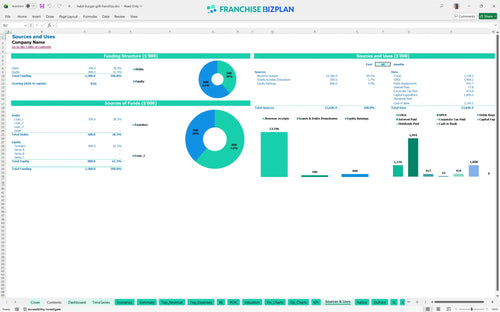
You will need approximately $1.8M to cover fast casual franchise startup costs and capital expenditure forecasting. This includes the $35,000 franchise fee, $750,000 for leasehold improvements, and $350,000 for specialized kitchen equipment like grills and fryers. How to calculate startup costs for a burger franchise becomes simple when you map these big-ticket items against your opening cash needs.
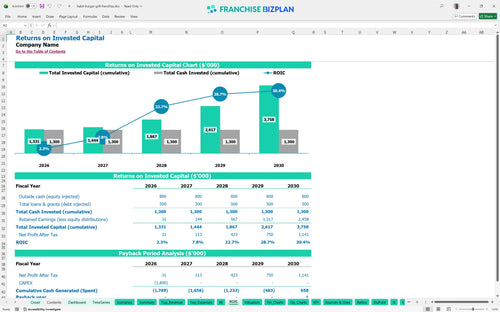
The franchise investment return on investment calculator shows a 5-year payback period and an IRR of 2.58%. While the initial investment is significant, the franchise investment feasibility is supported by a 3.07% return on equity and strong cash flow growth as the unit matures.
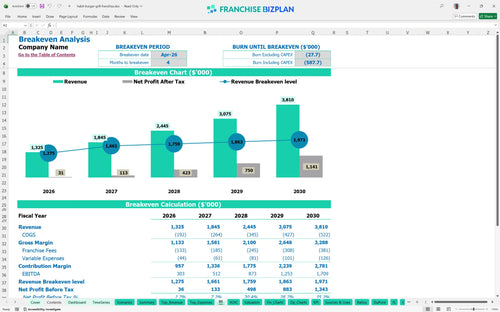
The unit reaches its monthly break-even point in April 2026, just 4 months after opening. Forecasting revenue for new restaurant franchise location success requires hitting these early targets to cover the $18,000 monthly rent and $3,200 utility burden.
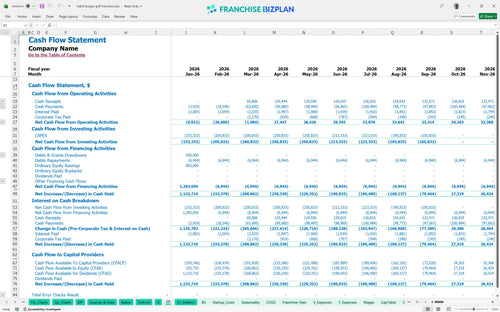
The lowest cash point occurs in September 2026 at -$404,000, which serves as your startup budget template for retail food franchise planning. You need enough working capital to survive this ramp-up phase before the unit becomes self-sustaining and begins replenishing your reserves.
A high-performance scenario significantly improves your restaurant ROI analysis by shortening the payback period and increasing year-one margins. If sales hit the high case, your EBITDA expansion accelerates, but a low-revenue scenario will require tighter control over the $78,000 GM salary and other fixed costs.
Finance: update unit break-even and payback model by Friday
This burger restaurant franchise financial model is built in Excel with fully editable assumptions, allowing you to swap out local rent prices or adjust labor rates to fit your specific market. It uses a restaurant franchise profitability analysis Excel framework so you can change food costs or menu pricing and instantly see the impact on your bottom line. Every formula is open, making it easy to adapt the model for a single unit or a growing multi-unit portfolio.

Success in the food business requires looking past the grand opening, so this model provides detailed financial projections for restaurant franchise operations over a sixty-month period. You can track your growth from $1.3M in year one to over $3.8M by year five, helping you visualize the long-term restaurant franchise business plan template. It includes full income statements, cash flow tracking, and balance sheets to satisfy both your internal planning and external lender requirements.

Operating a branded concept means managing specific off-the-top costs like the 5.5% royalty and 4.5% marketing fund contributions. This model treats these as non-negotiable QSR operating expenses, calculating them automatically against your gross sales so you know exactly what remains for local overhead. It helps you track the initial $35,000 fee alongside ongoing brand obligations to ensure your store-level margins stay healthy after all corporate payments.

Calculating break-even point for quick service restaurant units is the first step in de-risking your investment. This quick service restaurant profit and loss template breaks down your $18,000 monthly rent and other fixed costs against your variable margins to find your monthly sales target. It provides a clear view of the total $1.8M startup investment and the exact moment your unit starts generating a surplus.

This franchise financial projection spreadsheet includes researched benchmarks for labor and food costs to help you identify best practices for evaluating franchise unit performance. If your kitchen staff costs or utility bills drift outside typical ranges, the model flags the variance so you can take action. It is a reality check that compares your projected 13% food cost against industry standards to ensure your plan is grounded in real-world economics.


Simply purchase and download the financial model template, then access it instantly using Microsoft Excel or Google Sheets. No installation or technical expertise required-just open and start working.

Enter your business-specific numbers, including revenue projections, costs, and investment details. The pre-built formulas will automatically calculate financial insights, saving you time and effort.

Leverage the investor-ready format to confidently showcase your financial projections to banks, franchise representatives, or investors. Impress stakeholders with clear, data-driven insights and professional reports.

Leverage the investor-ready format to confidently present your projections to banks, franchise representatives, or investors.