
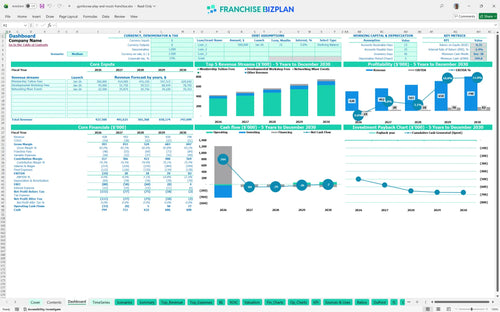
All-in-one Dashboard
Core inputs and core outputs


This franchise unit financial model template provides a complete Excel-based toolkit for projecting revenue, managing child-enrichment center expenses, and calculating your total investment return.
Core inputs and core outputs
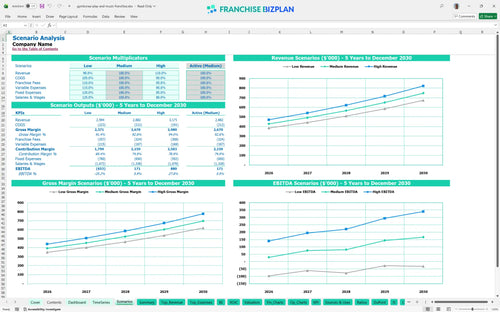
Three scenario analysis
Presentation ready
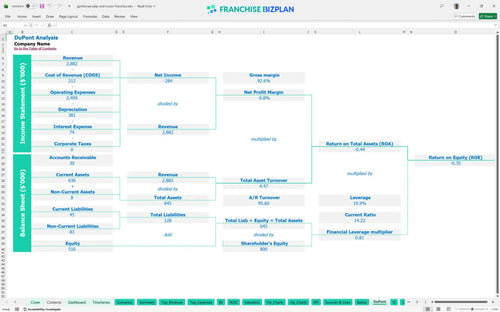
DuPont analysis
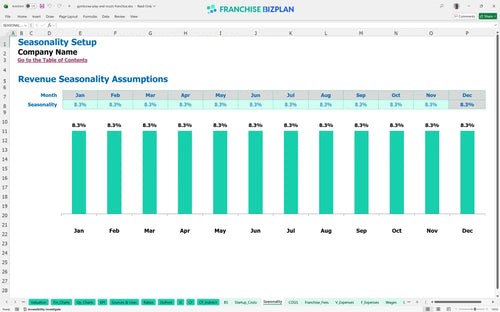
Researched revenue assumptions
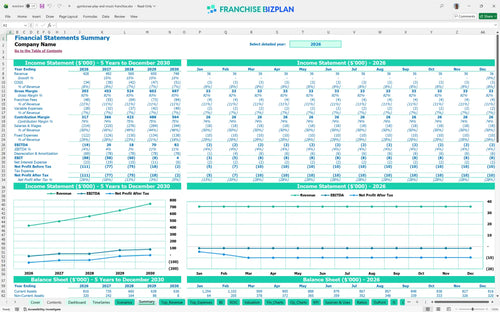
Lender-friendly financial outputs
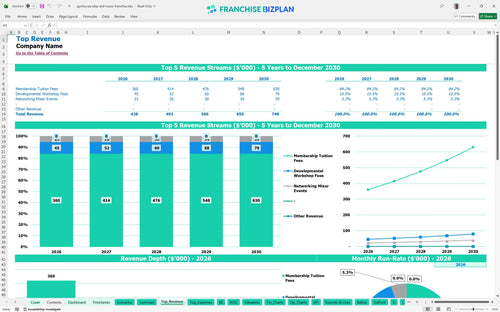
Revenue stream detailed view
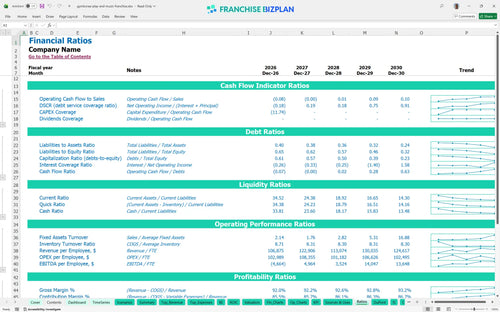
Performance metrics benchmark
We built this franchise unit financial model using extensive research into the unit economics of a premier children's activity center. The pre-populated assumptions-including a $428,000 year-one revenue target and an 8% royalty structure-provide a data-driven starting point that you can fully customize to your local market. Data beats gut feelings every single time.
Based on the researched data, this franchise unit is projected to reach positive EBITDA in Year 2, with earnings of approximately $20,000. While Year 1 shows a modest loss of $19,000 during the ramp-up phase, the model shows profitability defintely scaling to $82,000 by Year 5 as membership tuition fees grow. Profit isn't an accident; it's a scheduled event.
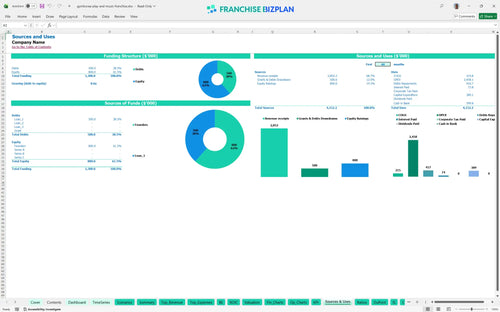
The total initial investment for this unit is approximately $389,100, covering everything from the $45,000 franchise fee to the $150,000 leasehold buildout. You will also need to account for $120,000 in proprietary play equipment and a technology setup of $34,100 to ensure the facility meets brand standards. Capital is your fuel, and you can't afford a leak.
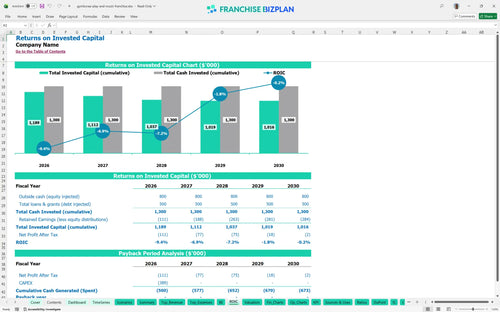
The ROI analysis for franchises in this category shows a longer-term play, with a payback period extending beyond the initial five years and a projected IRR of -2.35% based on current growth rates. While the Year 5 revenue reaches $748,000, the high initial CAPEX and fixed rent of $8,500 monthly mean you must focus on aggressive local marketing to shorten the payback window. Long-term returns require a clear-eyed view of the initial burn.
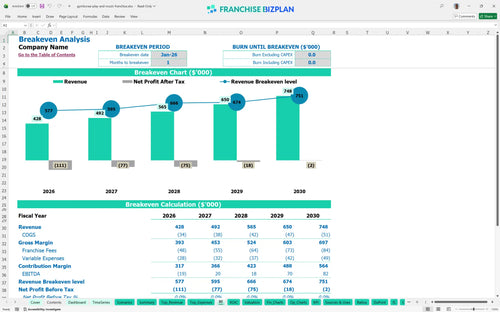
The model indicates a very fast technical break-even date in January 2026, assuming you hit the ground running with established membership tuition fees. The primary driver for maintaining this is managing the $8,500 monthly rent in the Mueller district, which represents a significant fixed cost that requires high throughput and a strong average ticket. Speed to break-even is the best metric for early-stage survival.
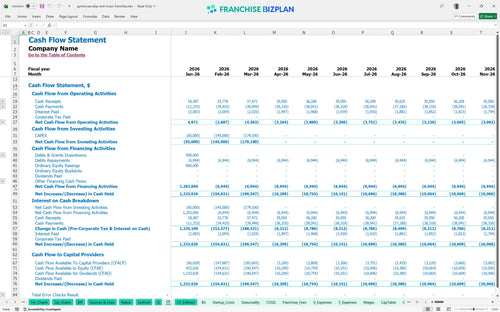
The lowest cash point in this model is projected at $600,000, suggesting a significant capital buffer is maintained throughout the five-year period to handle fluctuations in enrollment. You should monitor the Dec-30 period closely as it represents the minimum cash month in this specific projection scenario. Cash is oxygen, and your runway determines how long you can breathe.
Switching to a High scenario-driven by better local marketing execution and higher workshop fees-can significantly pull forward the payback period and increase the Year 1 margin. Conversely, a Low scenario with 15% lower revenue would extend the EBITDA losses into Year 3, requiring additional working capital to sustain operations. Planning for the worst while aiming for the best is just good business.
Finance: update unit break-even and payback model by Friday.
This franchise financial model is a professional-grade Excel tool designed for precision and flexibility. You can easily modify every assumption, from membership pricing to local labor rates, ensuring the projections match your specific territory and lease terms. The pre-filled formulas handle the heavy lifting, so you can focus on testing different business scenarios without breaking the logic. You control the variables, the model handles the math.

Planning for a children's play center business plan requires a long-term lens to account for the initial ramp-up and eventual maturity. This model provides a detailed 5-year outlook, including revenue growth, tiered cost structures, and cash flow requirements. By mapping out sixty months of operations, you can identify exactly when the unit transitions from a cash-burn phase to a steady-state profit engine. Five years of foresight helps you avoid expensive hindsight.

Operating within a system means accounting for specific top-line deductions that impact your store-level margin. This model integrates the initial franchise fee, ongoing royalties, and brand marketing fund contributions directly into the cash flow statement. It helps you visualize how these fees affect your bottom line as you scale from a single unit to a multi-unit portfolio. Royalties are a top-line hit, so you need to see the net impact early.

Understanding how to calculate startup costs for a children's activity franchise is critical for securing funding and managing your initial runway. The model breaks down the total investment-including leasehold improvements, equipment, and pre-opening marketing-while calculating the exact sales volume needed to cover your monthly fixed costs. This clarity allows you to set realistic targets for your center director and staff. Knowing your break-even number is the difference between guessing and growing.

We have integrated industry-standard benchmarks for child enrichment center investment models to help you sanity-check your numbers. You can compare your projected labor costs, rent-to-revenue ratios, and gross margins against typical performance data for similar early childhood development businesses. This ensures your financial planning for child development business is grounded in reality rather than optimism. Don't build in a vacuum; use benchmarks to see if your rent is killing your margin.


Simply purchase and download the financial model template, then access it instantly using Microsoft Excel or Google Sheets. No installation or technical expertise required-just open and start working.

Enter your business-specific numbers, including revenue projections, costs, and investment details. The pre-built formulas will automatically calculate financial insights, saving you time and effort.

Leverage the investor-ready format to confidently showcase your financial projections to banks, franchise representatives, or investors. Impress stakeholders with clear, data-driven insights and professional reports.

Leverage the investor-ready format to confidently present your projections to banks, franchise representatives, or investors.