
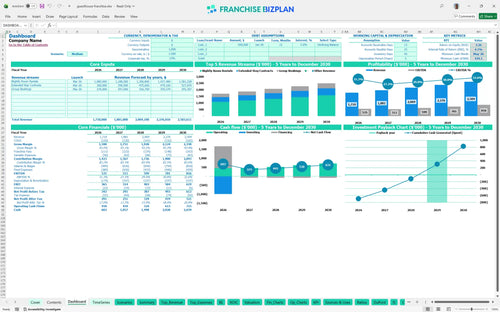
All-in-one Dashboard
Core inputs and core outputs


This hotel franchise financial model provides a complete Excel toolkit including dynamic revenue drivers, detailed capital expenditure planning, and a full franchise profit and loss statement.
Core inputs and core outputs
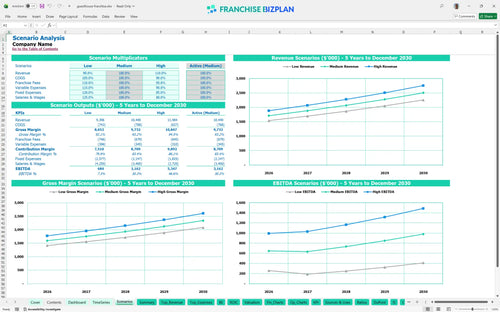
Three scenario analysis
Presentation ready
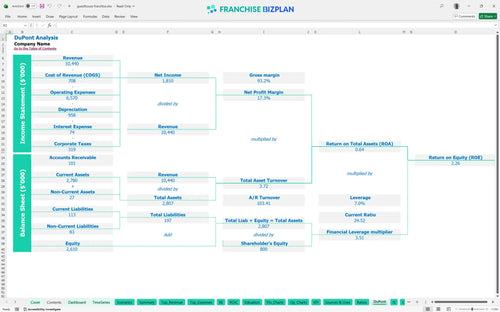
DuPont analysis
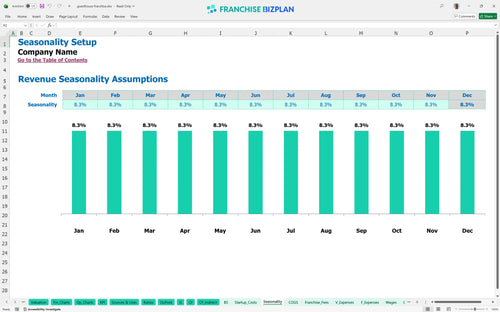
Researched revenue assumptions
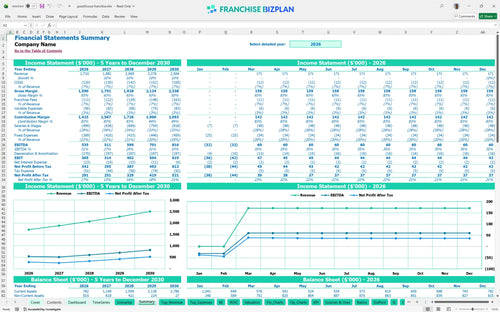
Lender-friendly financial outputs
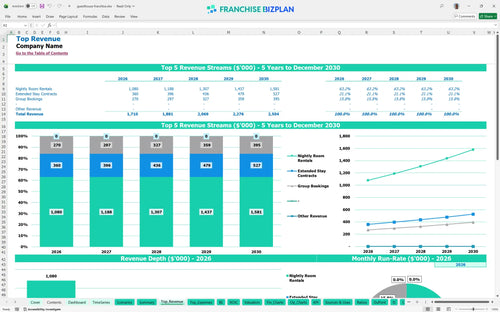
Revenue stream detailed view
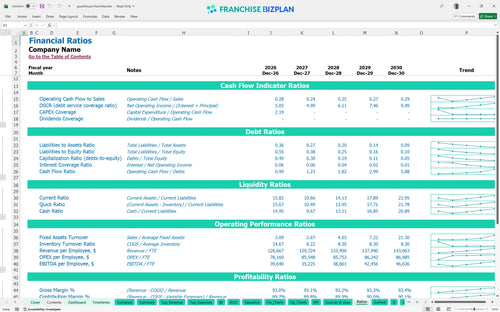
Performance metrics benchmark
We built this business plan template for medical hub hospitality units using our own research into the Savannah Midtown corridor. Key assumptions like the $1,710,000 Year 1 revenue and the $15,000 franchise fee are pre-populated and fully editable to match your specific site. It's a practical tool designed to help you navigate the 4-year payback period with confidence.
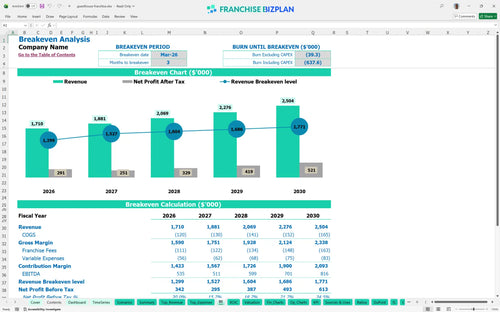
You hit profitability quickly, reaching break-even by March 2026. After accounting for the 5% royalty and 1.5% marketing fees, the unit generates a Year 1 EBITDA of $535,000. This hotel franchise unit profit margin analysis shows the trajectory is strong as you scale nightly room rentals.
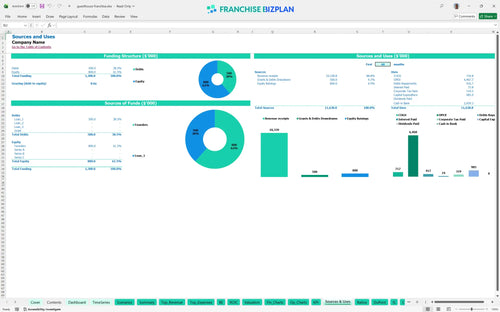
Launching this unit requires significant upfront capital, primarily for the $450,000 leasehold improvements and $250,000 in furnishings. The model tracks how to calculate startup costs for a hotel franchise so you don't run dry before the doors open.
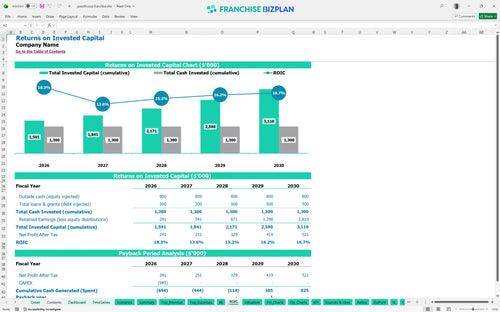
This franchise unit return on investment analysis shows a 4-year payback period and an IRR of 4.12%. With a Return on Equity of 2.26, the model demonstrates a steady climb in value for a mid-scale hospitality asset.
Monthly break-even occurs in March 2026, driven by the need to cover $18,000 in rent and $7,000 in utilities. This hotel franchise cash flow projection worksheet highlights that if labor costs for the 7 housekeeping staff rise, your break-even volume will shift higher.
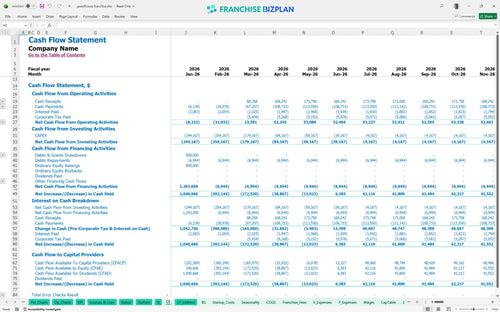
Your minimum cash balance hits $424,000 in May 2026 during the critical ramp-up phase. Estimating operating expenses for a mid-scale hotel accurately is vital here to ensure you have enough runway to cover the $75,000 GM salary before revenue stabilizes.
Financial planning for boutique hotel franchisees requires testing how a 10% revenue drop impacts your 4-year payback. Budgeting for hotel franchise renovation and maintenance in the high-case scenario shows how Year 5 EBITDA can climb toward $816,000 with better local marketing execution.
This Excel template for hotel franchise business valuation lets you tweak every variable, from nightly rates to housekeeping supply costs. We built in the formulas so you can test different Savannah scenarios without breaking the math. It's about making the numbers yours, not just following a static sheet.

Map out your growth from a Year 1 revenue of $1,710,000 to over $2.5 million by Year 5 using this extended stay hotel financial model template. This franchise unit business plan template tracks how EBITDA evolves as you stabilize occupancy and manage labor across sixty months. Long-term hospitality industry financial forecasting is the only way to see if the mid-scale play actually pays off.

The model accounts for the $15,000 initial fee plus the ongoing 5% royalty and 1.5% marketing fund contributions. These franchise royalty fees are baked into the monthly cash flow so there are no surprises when the franchisor drafts your account. It defintely helps to see exactly how much top-line revenue stays in your pocket.

Use the franchise startup cost calculator to total up the $450,000 in leasehold improvements and $250,000 in guest room furnishings. We show you exactly when you hit the break-even date-currently projected for March 2026-based on your fixed rent and variable OTA commissions. Knowing your floor is the first step to sleeping through the night.

We included hospitality industry financial forecasting benchmarks to ensure your 4.8% housekeeping supply cost and 2.2% laundry expense stay within realistic ranges. This hotel investment feasibility study compares your Revenue per available room (RevPAR) drivers against mid-scale standards to flag red flags early. If your labor costs spike, the model shows the impact on your store-level margin immediately.


Simply purchase and download the financial model template, then access it instantly using Microsoft Excel or Google Sheets. No installation or technical expertise required-just open and start working.

Enter your business-specific numbers, including revenue projections, costs, and investment details. The pre-built formulas will automatically calculate financial insights, saving you time and effort.

Leverage the investor-ready format to confidently showcase your financial projections to banks, franchise representatives, or investors. Impress stakeholders with clear, data-driven insights and professional reports.

Leverage the investor-ready format to confidently present your projections to banks, franchise representatives, or investors.