


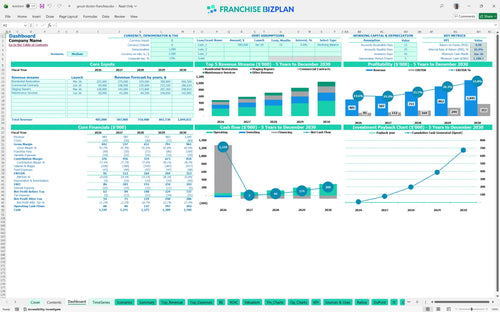
All-in-one Dashboard
Core inputs and core outputs



This franchise unit financial forecasting spreadsheet provides a complete toolkit for estimating profit margins for grout and tile service business units, including CAPEX, payroll, and 60-month cash flow statements.
Core inputs and core outputs
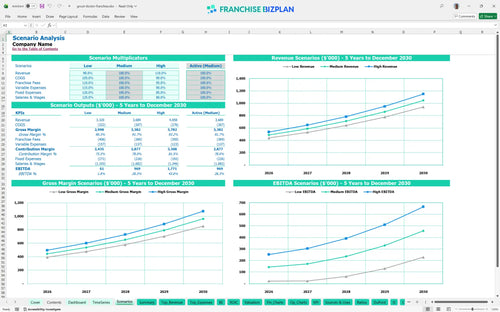
Three scenario analysis
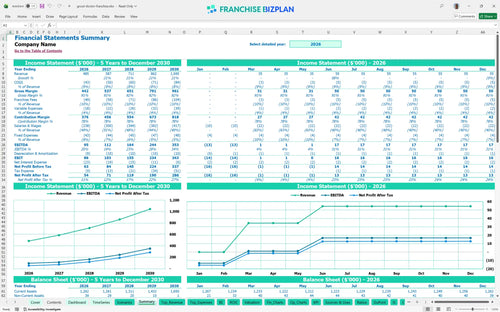
Presentation ready
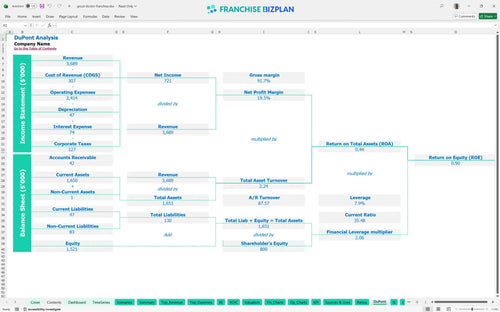
DuPont analysis
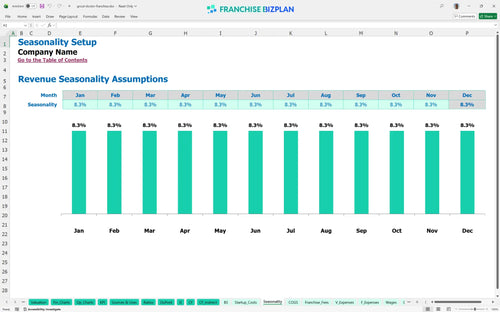
Researched revenue assumptions
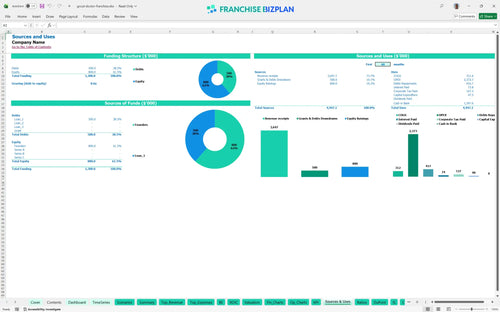
Lender-friendly financial outputs
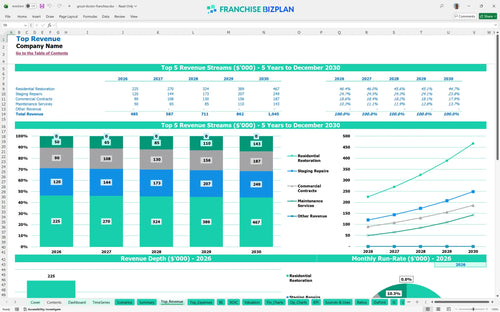
Revenue stream detailed view
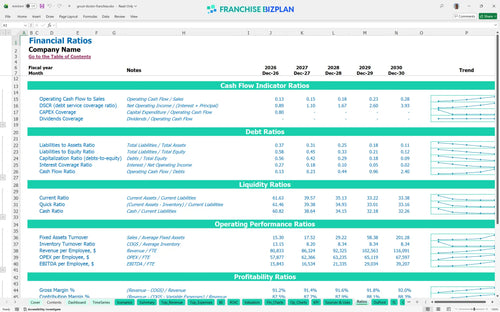
Performance metrics benchmark
We built this franchise unit financial model using our own research into the grout restoration sector for preparing a business plan for a niche service franchise. Key assumptions like the $485,000 year-one revenue target and 10% total franchise fees are pre-populated but fully editable to match your specific territory. It is a practical way to see how a $20,000 franchise fee translates into a $353,000 EBITDA by year five.
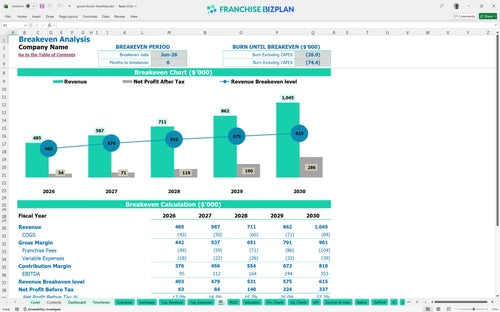
The model shows this unit hits its stride quickly, reaching breakeven by June 2026, just six months after launch. With year-one EBITDA starting at $95,000, you are looking at a steady climb as you focus on determining recurring revenue for commercial cleaning contracts alongside residential projects.
You will need roughly $47,500 in initial capital to cover the franchise fee, service vehicle, and specialized cleaning equipment. This detailed breakdown of franchise operational costs ensures you have the cash to handle the $1,189 minimum cash point projected for mid-2026.
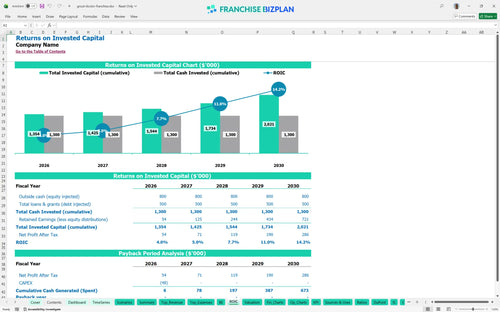
This franchise investment analysis for small business owners shows an internal rate of return (IRR) of 10.43% and a return on equity of 0.9. While the full payback occurs after year five, the ROI analysis shows significant cash flow growth as revenue doubles between years one and five.
The unit reaches its monthly break-even point in June 2026, driven primarily by the launch of residential restoration and staging repairs. Your ability to hit this depends on managing the $3,650 in monthly fixed costs, including the GM salary and vehicle lease payments.
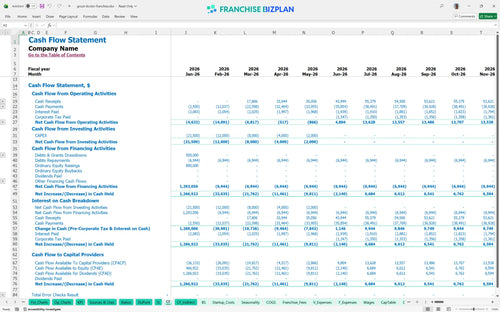
Your lowest cash point occurs in June 2026 at $1,189, meaning your working capital is tight during the first six months of ramp-up. You need enough runway to cover the $100,000+ in year-one salaries before the higher-volume commercial contracts fully kick in and stabilize the bank balance.
Evaluating profitability of mobile home service franchise units requires looking at how a 10% revenue drop impacts your $95,000 year-one EBITDA. While the high case in this Excel template for franchise unit revenue projections accelerates growth, the low case might push your payback period further out.
Finance: update unit break-even and payback model by Friday
This financial model template for home improvement franchise units is built in Excel, allowing you to tweak every assumption from residential restoration volume to specific technician pay. It uses pre-filled formulas so you can test different pricing for commercial contracts or adjust fuel costs without breaking the logic. This franchise financial model template makes it easy to adapt to your specific territory and local labor market.

Map out your long-term growth with detailed 5-year revenue forecasts that scale from $485,000 in year one to over $1 million by year five. This franchise unit business plan Excel tool tracks how your EBITDA projection expands as you add more service technicians and optimize your route density. It provides a clear view of how year-one EBITDA of $95,000 grows into $353,000 as the business matures.

Operating a niche service means keeping a close eye on the 9% royalty and 1% marketing fee. Our franchise royalty fees calculator ensures these off-the-top costs are baked into your cash flow forecasting so you know exactly what remains for local overhead. This helps you manage the timing gaps between performing the work and paying the franchisor.

Use the franchise startup cost calculator to account for the $20,000 initial fee plus equipment like high-pressure extractors and van branding. This tool helps you find the exact month your revenue covers your $3,650 monthly operating expense budget and fixed costs. Knowing how to calculate startup costs for a cleaning franchise is vital for maintaining enough liquidity during the first six months.

We defintely included benchmarks for home service franchise profitability analysis, such as restoration material costs starting at 7% of sales. Comparing your labor spend against these standards helps you maintain the healthy margins projected in this model. These benchmarks let you sanity-check your assumptions against real-world performance for similar niche service units.


Simply purchase and download the financial model template, then access it instantly using Microsoft Excel or Google Sheets. No installation or technical expertise required-just open and start working.

Enter your business-specific numbers, including revenue projections, costs, and investment details. The pre-built formulas will automatically calculate financial insights, saving you time and effort.

Leverage the investor-ready format to confidently showcase your financial projections to banks, franchise representatives, or investors. Impress stakeholders with clear, data-driven insights and professional reports.

Leverage the investor-ready format to confidently present your projections to banks, franchise representatives, or investors.