
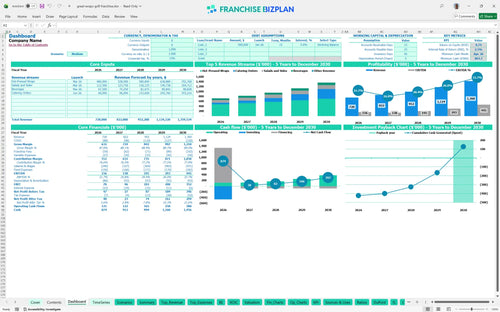
All-in-one Dashboard
Core inputs and core outputs


This comprehensive toolkit provides a professional-grade franchise financial model designed to help you forecast revenue, manage expenses, and track unit-level profitability over a five-year horizon.
Core inputs and core outputs
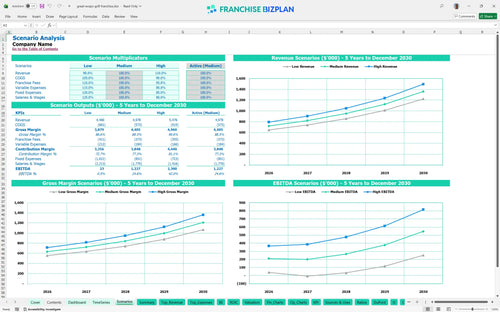
Three scenario analysis
Presentation ready
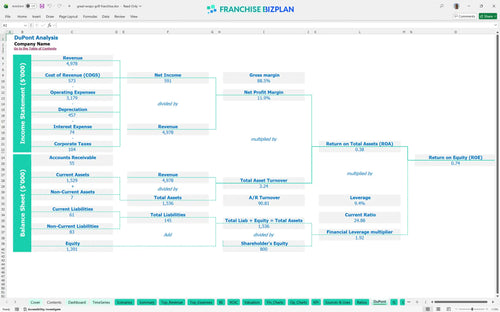
DuPont analysis
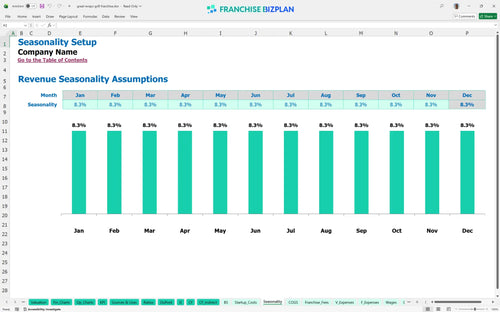
Researched revenue assumptions
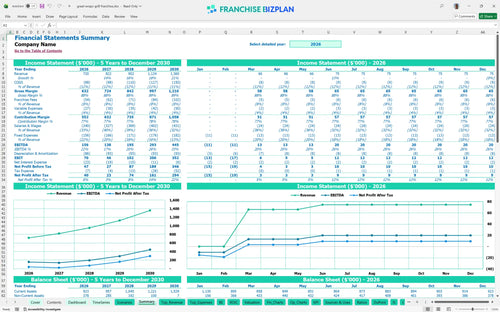
Lender-friendly financial outputs
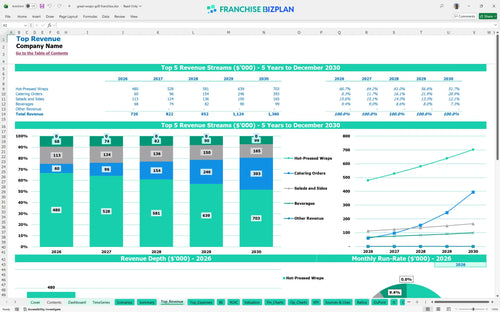
Revenue stream detailed view
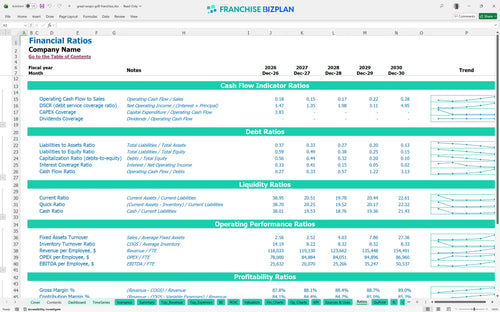
Performance metrics benchmark
We built this franchise unit financial model using our own research into the fast-casual sector. Key assumptions like the $720,000 year-one revenue and the 3-month ramp-up to breakeven are pre-populated and fully editable to fit your specific territory. It's a practical tool for seeing how royalties, marketing fees, and labor costs actually hit your bottom line.
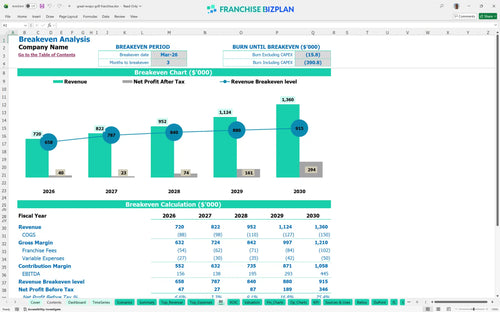
This franchise unit profitability analysis shows you reaching breakeven by March 2026, just three months after launching. With a Year 1 EBITDA of $156,000 and a Year 5 target of $445,000, the trajectory is defintely strong if you maintain your 5.5% royalty structure. Speed to profit is the only metric that keeps the lights on.
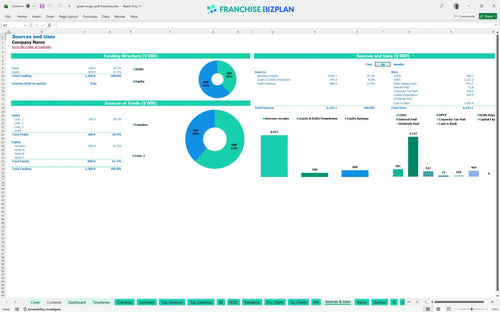
To get this unit off the ground, you are looking at a total startup investment of roughly $464,000. This covers everything from the $200,000 leasehold improvements to the $70,000 in grill and cooking equipment needed for high-volume throughput. You can't start a fire without the right wood.
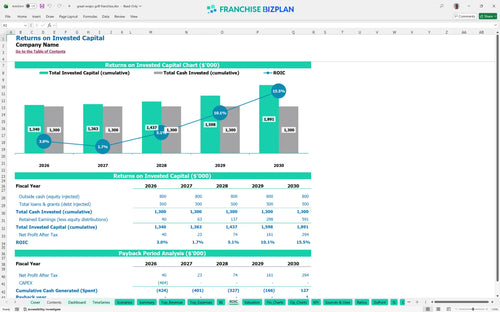
Based on the current ROI analysis, you can expect a 5-year payback period and an internal rate of return of 2.46%. While the initial years are about recouping the $464k investment, the franchise investment calculator shows a steady climb in equity value. Real returns take time and discipline.
The restaurant franchise break-even analysis tool indicates you need to hit your stride by month three to cover the $9,000 monthly rent and $1,600 in utilities. Your primary lever for hitting this is volume, specifically driving traffic for those hot-pressed wraps during the lunch rush. Three months to zero is a sprint, not a marathon.
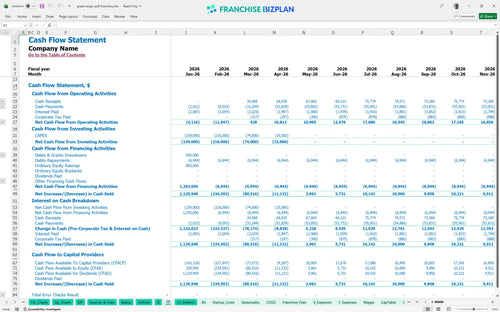
Your lowest cash point hits in April 2026 at $804,000, which includes a healthy buffer for operating expenses during the ramp-up phase. We recommend keeping this cushion to handle any delays in catering contract starts or unexpected utility spikes. Cash is oxygen; don't run out mid-climb.
In the high-growth scenario, evaluating profitability of high-traffic retail franchise locations shows EBITDA jumping from $156k to $445k as catering scales. The financial projection template for retail food units helps you see how a 10% drop in traffic impacts your ability to cover the fixed $9,000 rent. Plan for the worst, but execute for the best.
This fast casual restaurant financial model template is built in Excel with fully editable assumptions, allowing you to swap out our researched data for your own site-specific numbers. Every formula is open, so you can adjust the franchise financial model to reflect different lease terms, local labor rates, or menu pricing strategies. It's your business, so the numbers should be yours too.

Plan for the long haul with a detailed cash flow projection that tracks your unit from the first month of build-out through five years of operations. This restaurant franchise business plan tool maps out how revenue grows from an initial $720,000 to over $1.3 million as you mature in your market. Five years is a long time, but you need a map.

Operating a brand means managing specific overhead like the 5.5% royalty fees and 2.0% marketing fund contributions that come off the top. Our model simplifies analyzing franchise royalty and marketing fees by calculating these automatically based on your gross sales. Fees are just the price of entry for a proven system.

Before you flip the sign to open, you need to know exactly where your capital is going, from the $24,000 initial fee to the $200,000 build-out. This franchise business plan financial forecasting excel tool helps you visualize the total investment and the monthly sales volume needed to stay in the black. Knowing your floor is better than guessing your ceiling.

We've included unit economics benchmarks to help you see if your $9,000 monthly rent or 10.5% food cost is in line with the broader fast-casual market. Use these markers for determining labor cost percentages for quick service restaurants to ensure your staffing doesn't eat your margin. Don't fly blind when industry averages are available.


Simply purchase and download the financial model template, then access it instantly using Microsoft Excel or Google Sheets. No installation or technical expertise required-just open and start working.

Enter your business-specific numbers, including revenue projections, costs, and investment details. The pre-built formulas will automatically calculate financial insights, saving you time and effort.

Leverage the investor-ready format to confidently showcase your financial projections to banks, franchise representatives, or investors. Impress stakeholders with clear, data-driven insights and professional reports.

Leverage the investor-ready format to confidently present your projections to banks, franchise representatives, or investors.