
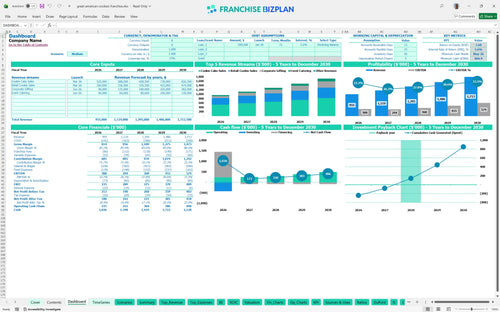
All-in-one Dashboard
Core inputs and core outputs


This is a complete franchise business plan Excel tool, including a financial model template for retail dessert store operations with pre-built P&L, cash flow, and startup budget tools.
Core inputs and core outputs
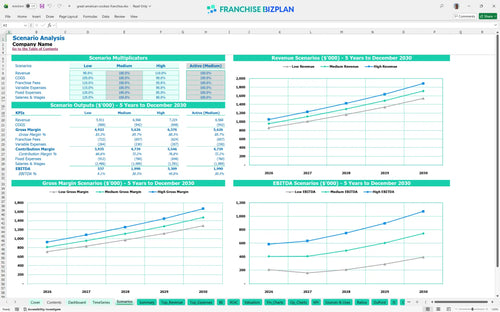
Three scenario analysis
Presentation ready
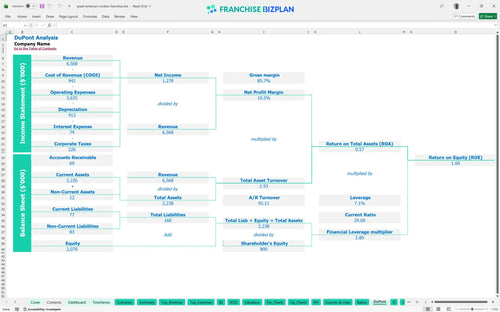
DuPont analysis
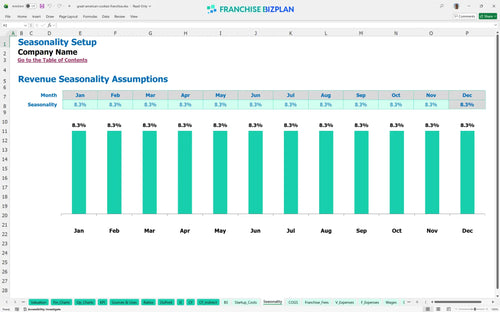
Researched revenue assumptions
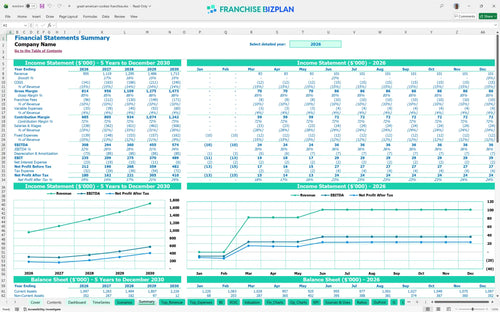
Lender-friendly financial outputs
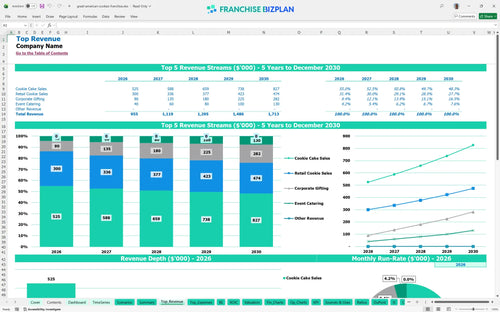
Revenue stream detailed view
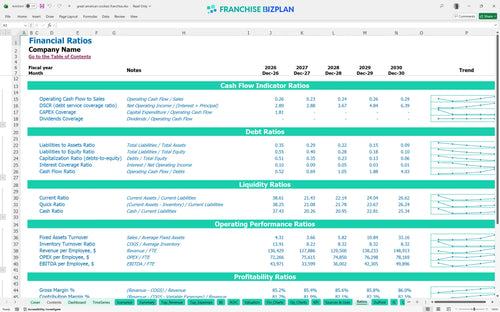
Performance metrics benchmark
We built this franchise unit financial model using our own research on specialty dessert concepts. Key assumptions like the $350,000 year-one cookie cake sales and $58,000 manager salary are pre-populated and fully editable to fit your specific market. This franchise unit profitability analysis gives you a data-driven look at how a $955,000 annual volume translates into store-level EBITDA (earnings before interest, taxes, depreciation, and amortization) of $308,000 in the first year.
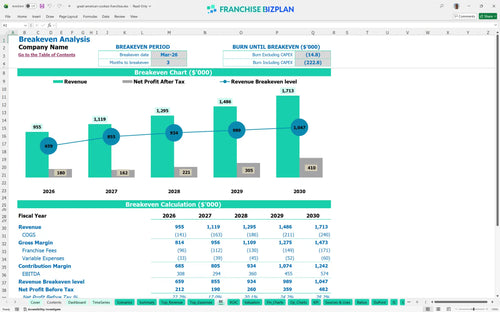
The unit hits its stride quickly, reaching breakeven in just 3 months by March 2026. With Year 1 EBITDA projected at $308,000, the model shows strong early performance even after accounting for the 10% combined royalty and marketing fees. Still, you need to watch the dip in Year 2 EBITDA to $294,000 as labor costs for decorators and crew members scale up to meet demand.
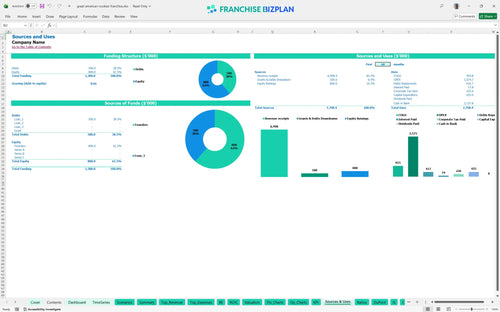
You will need a significant capital stack to launch, with leasehold improvements alone costing $220,000. Total startup costs include the $25,000 franchise fee and $60,000 for ovens and mixers, plus a healthy cash buffer to handle the $867,000 minimum cash requirement in May 2026. This startup budget template for specialty retail franchises ensures you account for every display case and POS system before opening day.
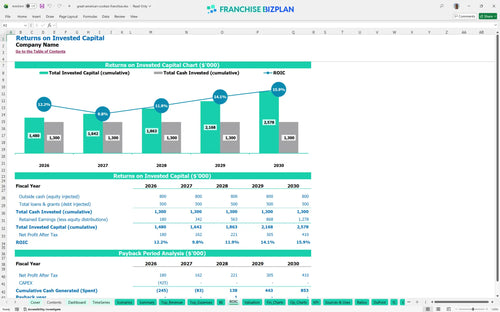
The model projects a 3-year payback period, which is standard for high-traffic retail dessert concepts. With an IRR (Internal Rate of Return) of 5.57% and a Return on Equity (ROE) of 1.6, the focus is on steady cash flow rather than explosive equity multiples. This franchise investment ROI calculation assumes you maintain the projected growth from $955k to $1.7M over the five-year hold period.
You reach break-even in month 3, but the real driver is maintaining high-margin sales like cookie cakes, which start at $350,000 annually. If food ingredients stay at 13% and you manage the $8,500 monthly rent, your margin of safety remains defintely comfortable. This franchise unit financial forecasting spreadsheet helps you identify the exact daily traffic needed to cover your fixed costs of roughly $12,000 per month.
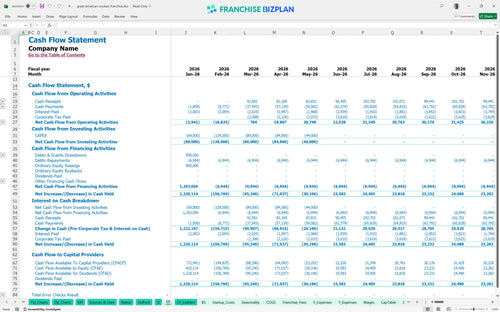
The lowest cash point occurs in May 2026, just a few months after opening. You need to maintain a minimum cash balance of $867,000 to navigate the initial ramp-up and handle the timing of leasehold payments and equipment installs. This best financial planning tools for franchise owners approach ensures you don't run out of gas just as the 'Cookie Cake Concierge' service begins to take off in June.
The model allows for Low, Medium, and High scenarios to test how a 10% drop in retail cookie sales affects your year-1 EBITDA. While the medium case shows $308,000 in profit, a high-performance scenario driven by corporate gifting could push revenue toward the $1.7M mark faster. Estimating profitability for a new franchise location requires looking at these variables to prepare for the reality of fluctuating local demand.
This franchise financial model template is built in Excel, allowing you to swap out assumptions for your specific territory or lease terms. You can adjust everything from cookie cake pricing to hourly wages for decorators, ensuring the pro forma reflects your local labor market. Because it is fully customizable, you can test how different staffing levels or rent bumps impact your bottom line before you sign a lease. It is a practical tool for anyone needing to move beyond generic estimates to a store-specific plan.

We mapped out a 5-year growth path that scales from $955,000 in initial annual sales to over $1.7M by year five. This retail franchise financial projections tool helps you visualize how corporate gifting and event catering revenue streams mature over time. By looking five years out, you can see the compounding effect of annual growth and how the unit handles rising labor costs as your team expands from 3 to 5.5 full-time equivalent crew members. It provides the long-range visibility needed for multi-unit planning and debt service coverage.

Analyzing franchise royalty and marketing fund impact is critical because these are 'off the top' costs that don't go away. This model calculates the 6% royalty and 4% marketing fee automatically, showing you exactly how much cash stays in the unit after the brand takes its 10% cut. At $955,000 in year-one revenue, that is nearly $95,500 leaving the store before you pay your own rent or light bill. Understanding this franchise royalty and fee structure ensures you don't over-leverage the business during the early ramp-up phase.

Knowing how to calculate startup costs for a food franchise prevents mid-build-out cash crunches. We've included a break-even analysis for small business owners that identifies the exact monthly volume needed to cover your $8,500 prime location rent and $1,200 utility bill. The model totals your initial investment, including the $25,000 franchise fee and $220,000 in leasehold improvements, so you know exactly how much skin you need in the game. It simplifies the math between your total food franchise startup costs and your first day of black ink.

Use this Excel template for franchise operational expenses to see if your 13% food ingredient cost is in line with specialty retail standards. It includes benchmarks for labor and occupancy, so you can spot if your staffing plan for five crew members is too heavy for your current traffic. Comparing your projected unit economics for franchises against these built-in industry standards helps you sanity-check your business plan. If your rent is significantly higher than the 9-10% range, the model will show you exactly how much more cookie volume you need to stay profitable.


Simply purchase and download the financial model template, then access it instantly using Microsoft Excel or Google Sheets. No installation or technical expertise required-just open and start working.

Enter your business-specific numbers, including revenue projections, costs, and investment details. The pre-built formulas will automatically calculate financial insights, saving you time and effort.

Leverage the investor-ready format to confidently showcase your financial projections to banks, franchise representatives, or investors. Impress stakeholders with clear, data-driven insights and professional reports.

Leverage the investor-ready format to confidently present your projections to banks, franchise representatives, or investors.