
All-in-one Dashboard
Core inputs and core outputs


This franchise unit financial forecasting model provides a comprehensive Excel framework to project revenue, manage automotive-specific costs, and calculate long-term investor returns.
Core inputs and core outputs
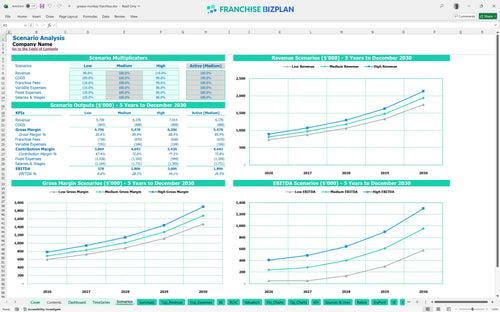
Three scenario analysis
Presentation ready
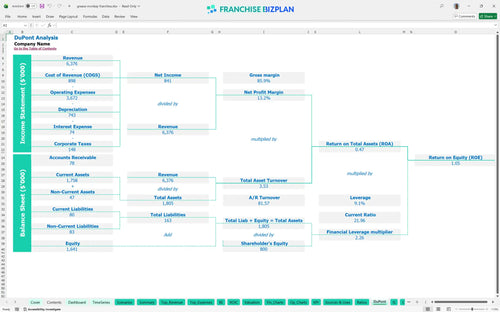
DuPont analysis
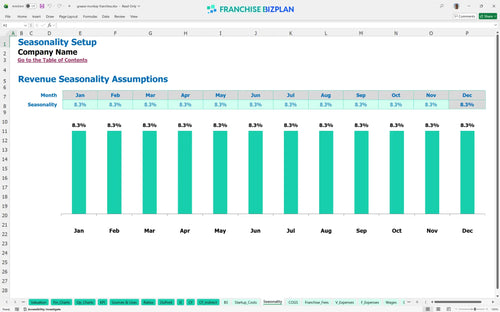
Researched revenue assumptions
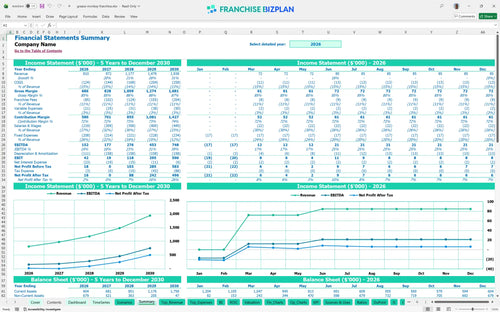
Lender-friendly financial outputs
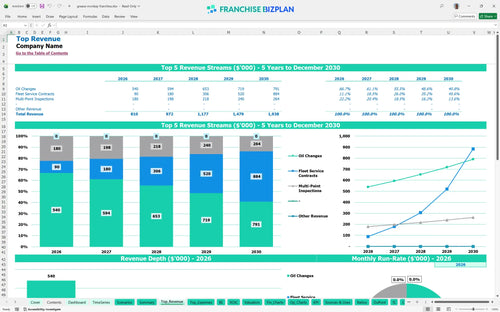
Revenue stream detailed view
Performance metrics benchmark
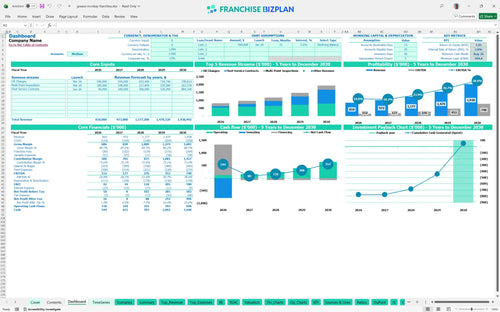
We built this Grease Monkey Franchise franchise unit financial model using our own research into the quick-lube and preventative maintenance industry. Key assumptions for oil changes, fleet service contracts, and 'Pit Crew' staffing are pre-populated and fully editable to match your specific location. With a year-one revenue target of $810,000 and a 5-year payback period, this tool provides the data-driven clarity needed for a confident investment.
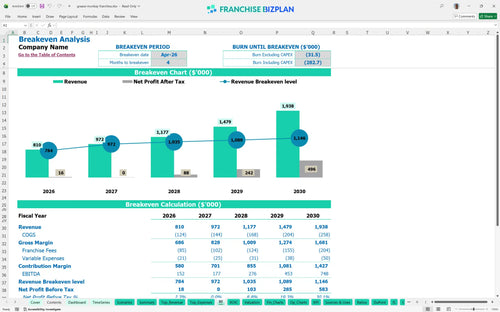
The unit is projected to reach its break-even point in April 2026, just four months after launching. By year five, EBITDA scales to $748,000 as high-margin fleet contracts and retail loyalty programs drive consistent volume through the bays.
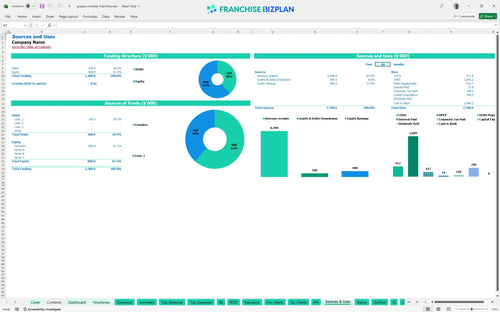
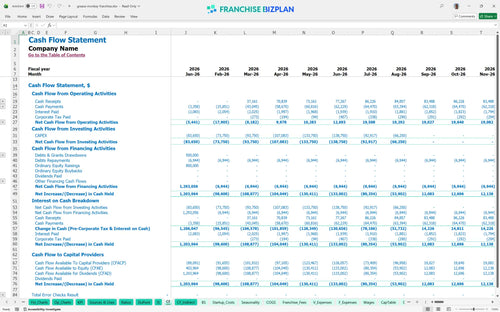
Opening this unit requires a total initial investment covering a $39,900 franchise fee and $350,000 for leasehold improvements. You will need a minimum cash position of $495,000 by August 2026 to handle the ramp-up and equipment costs for the 'Pit Crew' model.
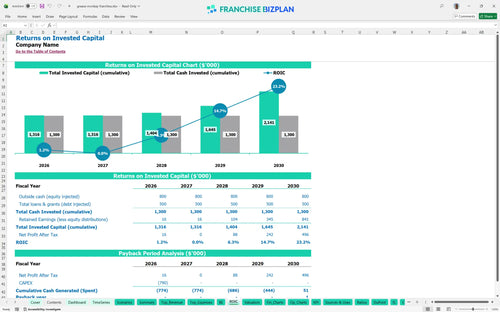
Franchisees can expect an internal rate of return (IRR) of 2.03% and a return on equity (ROE) of 1.05 over the initial five-year period. The franchise investment return calculator shows a 5-year payback period, reflecting the capital-intensive nature of high-tech automotive facilities.
The monthly break-even point depends on hitting volume targets to cover $10,000 in rent and $1,200 in local marketing. Throughput is the primary driver; if bay speed lags, your break-even date will defintely shift further into the first year.
Your lowest cash point hits in August 2026 at $495,000, requiring a solid buffer to manage pre-opening costs and equipment installs. Maintaining a strict focus on working capital during the first six months is vital to surviving the initial ramp-up phase.
In a high-growth scenario, revenue hits $1.9 million by year five, significantly expanding EBITDA margins as fixed costs stay flat. The model shows that hitting the high case depends on local marketing execution and securing recurring fleet contracts early in the cycle.
This franchise financial model is built in Excel with fully editable assumptions, allowing you to adjust every driver from bay throughput to technician hourly rates. You can swap out pre-filled data for your specific territory and local market conditions to see how different operating scenarios impact your bottom line. It is a flexible tool designed to help you calculate startup costs for an automotive franchise without needing a degree in finance.

Plan for long-term growth with a detailed five-year franchise financial projection that maps your journey from a single-unit startup to a mature service hub. The model tracks revenue scaling from $810,000 in year one to over $1.9 million by year five, providing a clear view of your expected cash flow and profit margins. This financial projection excel for new franchise owners ensures you are prepared for the ramp-up phase and beyond.

This model simplifies franchise royalty fees and ongoing brand obligations by automating the math behind a 6% royalty and 4.5% marketing fund contribution. By capturing these franchise-specific financial obligations upfront, you can see the real-world impact on your store-level EBITDA before you commit to a site. It is an essential part of any automotive franchise business plan to ensure your unit economics stay healthy after corporate fees.

Use this franchise startup cost template to estimate your total initial investment, including the $39,900 franchise fee and $350,000 in leasehold improvements. The break-even analysis identifies the exact revenue level needed to cover your $10,000 monthly rent and $72,000 manager salary. Knowing your numbers helps you manage the capital expenditure budget and avoid early-stage cash crunches.

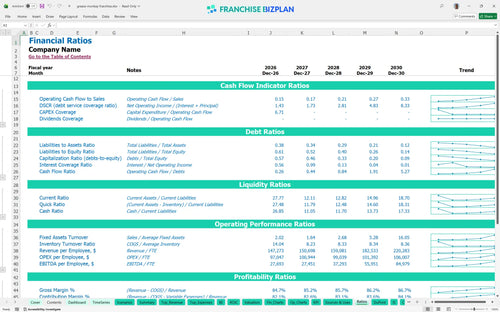
The model includes built-in industry benchmarks to help you sanity-check your operating expenses, such as keeping automotive parts costs between 11.5% and 13.5%. These standards allow you to compare your projected performance against typical ranges for labor, rent, and gross margins in the auto service sector. It acts as a franchise unit profitability spreadsheet that keeps your expectations grounded in reality.


Simply purchase and download the financial model template, then access it instantly using Microsoft Excel or Google Sheets. No installation or technical expertise required-just open and start working.

Enter your business-specific numbers, including revenue projections, costs, and investment details. The pre-built formulas will automatically calculate financial insights, saving you time and effort.

Leverage the investor-ready format to confidently showcase your financial projections to banks, franchise representatives, or investors. Impress stakeholders with clear, data-driven insights and professional reports.

Leverage the investor-ready format to confidently present your projections to banks, franchise representatives, or investors.