
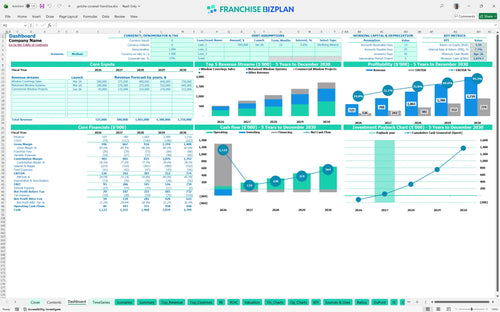
All-in-one Dashboard
Core inputs and core outputs


This franchise financial projection template includes everything from initial capital expenditure and multi-year revenue streams to detailed staffing plans and cash flow waterfalls.
Core inputs and core outputs
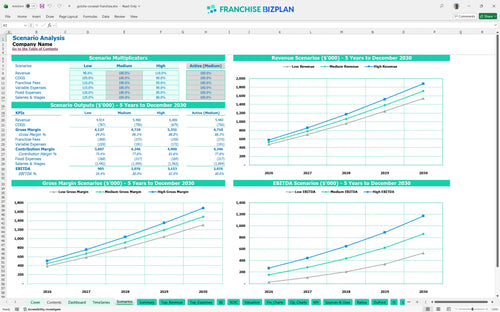
Three scenario analysis
Presentation ready
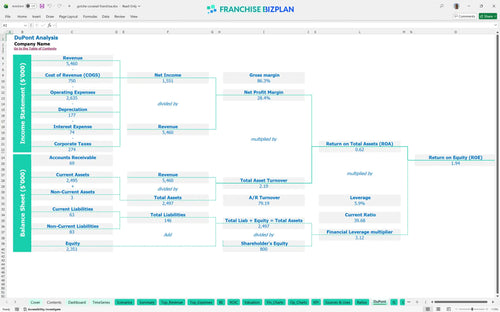
DuPont analysis
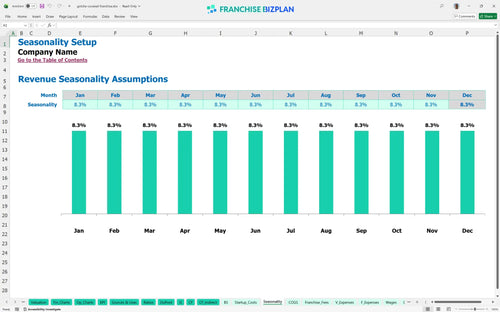
Researched revenue assumptions
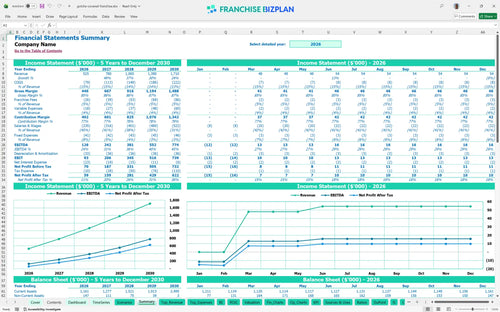
Lender-friendly financial outputs
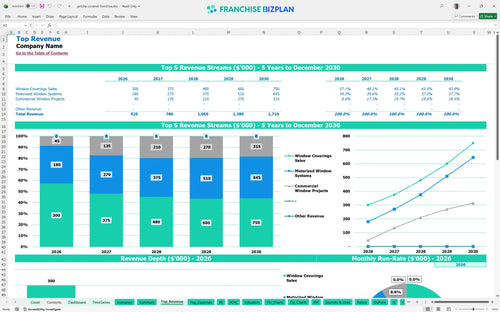
Revenue stream detailed view
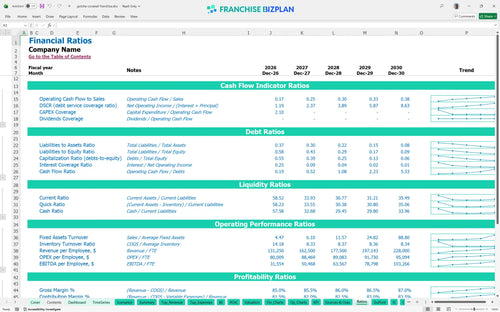
Performance metrics benchmark
We built this franchise unit financial model using our own research into the window treatment industry and mobile service economics. Key assumptions like the $525,000 year-one revenue and the $179,900 initial investment are pre-populated and ready for your input. It's a practical financial model template for new franchise owners designed to show you exactly how a 2-year payback period is achievable in this high-margin niche.
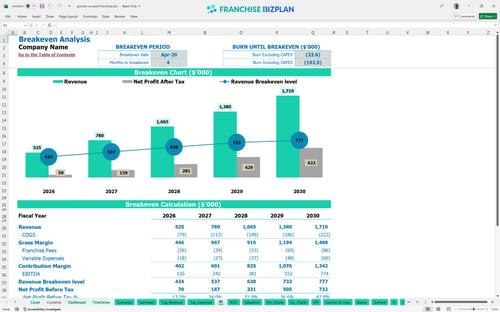
You hit the break-even point in April 2026, just four months after launch. By the end of year one, the model projects an EBITDA of $126,000, which grows significantly as you scale to $1.71M in annual revenue by year five. This window treatment franchise profit margin analysis shows that early profitability is tied to low fixed costs. Every month of delay in hiring your first installer is a month of lost margin.
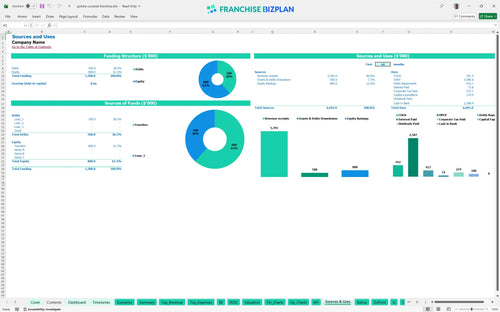
You need approximately $179,900 in franchise startup costs to launch this unit in the US. This capital expenditure covers the $69,900 franchise fee, a $45,000 mobile showroom, and $20,000 in initial fabric inventory. Cash is king, but in this model, inventory is the queen that keeps the king in power.
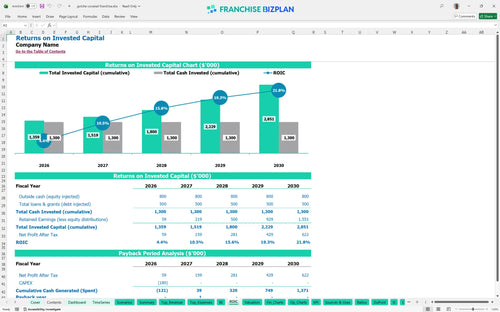
This ROI forecasting tool shows an Internal Rate of Return (IRR) of 7.66% and a Return on Equity (ROE) of 1.94. Calculating return on investment for service-based franchises is straightforward here because of the 2-year payback period. A two-year payback is the gold standard for service-based franchises.
Monthly break-even occurs in month 4, which is quite fast for the industry. Estimating operating expenses for mobile service businesses is easier when your fixed costs are only $3,400 monthly. Low overhead is your best insurance policy against a slow sales month.
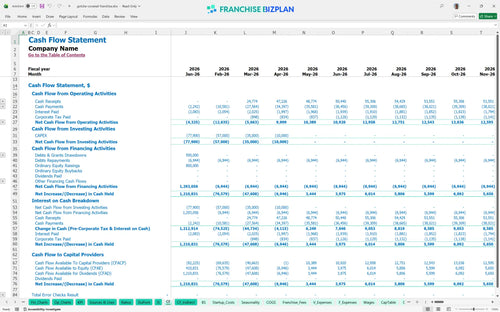
Your lowest cash point is $1,080,000 in April 2026, so you need a solid financial planning worksheet for franchise investors to manage that dip. Still, the operational cash flow turns positive quickly, meaning your runway risk is defintely lower than most service businesses. Watch your cash like a hawk during the first 120 days.
Using best practices for franchise financial forecasting, we look at unit economics across three tiers. High-case performance sees EBITDA jump to $774,000 by year five, which significantly impacts your franchise business valuation. The difference between good and great is your lead-to-close ratio.
Finance: update unit break-even and payback model by Friday.
This franchise financial model lives in Excel, giving you total control over the numbers. You can swap out the pre-filled assumptions for your specific territory or labor market without breaking the math. It's built to handle the nuances of a mobile service business where your overhead stays low but your volume can scale fast.

Planning for a window treatment business plan requires looking past the first year of hustle. This model provides a full 5-year outlook on revenue, EBITDA, and cash flow to help you see the forest for the trees. Whether you are managing one unit or planning a multi-unit expansion, these projections show how margins evolve as you add more installation technicians and design consultants.

Understanding the real cost of the brand is vital for any franchise profitability analysis. This tool tracks the $69,900 initial fee alongside ongoing obligations like the 5% marketing fund contribution. Since the royalty is currently modeled at 0%, you can see exactly how that impacts your bottom line compared to other concepts. It keeps your eyes on the net profit, not just the top-line sales.

Knowing how to calculate startup costs for a franchise is the difference between a smooth launch and a cash crunch. The model aggregates your mobile showroom vehicle, demo kits, and initial inventory to give you a clear target. It then maps these against your monthly fixed costs, like the $1,200 home office lease and insurance, to find your exact break-even point. This is the ultimate startup budget template for home-based franchises.

We've baked in franchise unit financial performance metrics so you aren't guessing in the dark. The model uses researched data for fabrics and hardware costs, which start around 11.5% and 3.5% respectively. This allows you to compare your actual performance against industry standards for analyzing profitability for custom window covering businesses and adjust your pricing if margins start to slip.


Simply purchase and download the financial model template, then access it instantly using Microsoft Excel or Google Sheets. No installation or technical expertise required-just open and start working.

Enter your business-specific numbers, including revenue projections, costs, and investment details. The pre-built formulas will automatically calculate financial insights, saving you time and effort.

Leverage the investor-ready format to confidently showcase your financial projections to banks, franchise representatives, or investors. Impress stakeholders with clear, data-driven insights and professional reports.

Leverage the investor-ready format to confidently present your projections to banks, franchise representatives, or investors.