
All-in-one Dashboard
Core inputs and core outputs


This Excel template for restaurant franchise financial planning provides a complete toolkit to forecast revenue, manage deli franchise startup costs, and analyze unit-level profitability.
Core inputs and core outputs
Three scenario analysis
Presentation ready
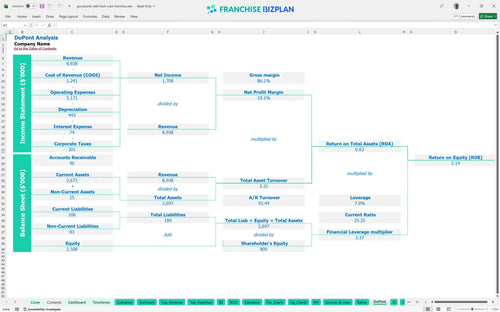
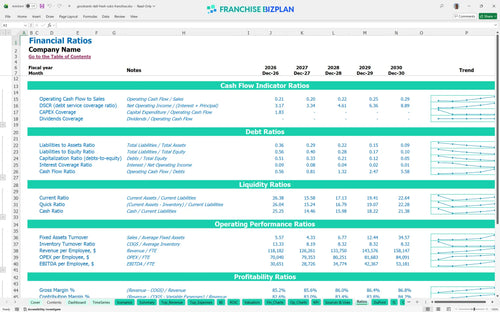
DuPont analysis
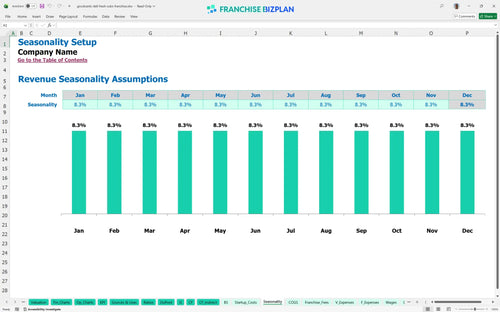
Researched revenue assumptions
Lender-friendly financial outputs
Revenue stream detailed view
Performance metrics benchmark
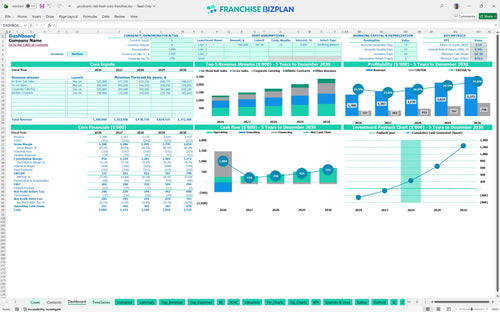
We built this franchise unit financial model using our own research into sub sandwich shop unit economics. Key assumptions, including the $11,000 monthly rent and tiered staffing for crew members, are pre-populated and fully editable for your specific location. With a Year 1 EBITDA of $337,000, this model helps you see if the numbers defintely work for your market.
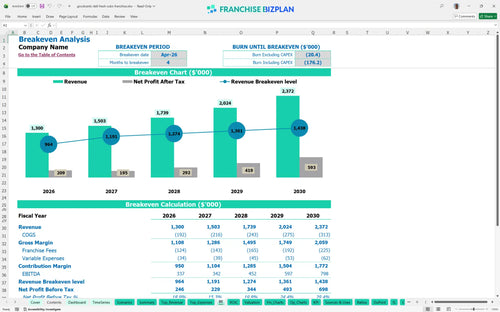
Based on the 4-month ramp-up, the unit hits monthly profitability by April 2026. This accounts for the 9.5% combined royalty and marketing load plus a food cost that trends down from 12.8% to 11.2% as you scale. Speed to profit depends on controlling your variable waste.
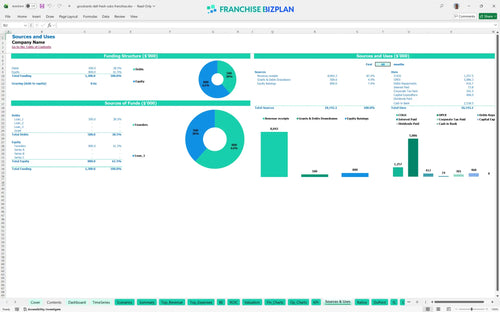
You will need roughly $468,000 in initial capital to cover the build-out and equipment. This includes the $30,000 franchise fee and a significant $220,000 investment in leasehold improvements to meet brand standards. Build-out costs are your biggest upfront hurdle.
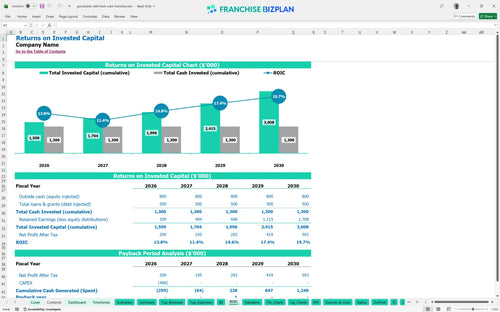
The model shows a 3-year payback period and an IRR of 6.37%. While the initial return on equity is 2.14, the real value is in the scaling EBITDA, which climbs to $798,000 by year five as you capture more athletic and corporate contracts. Efficiency in year five drives the real wealth.
You need to hit break-even by month four to stay on track. The primary driver here is throughput; with $11,000 in monthly rent and $15,000+ in management salaries, you need consistent daily volume across in-store and to-go channels. Volume is the only way to outrun high fixed rent.
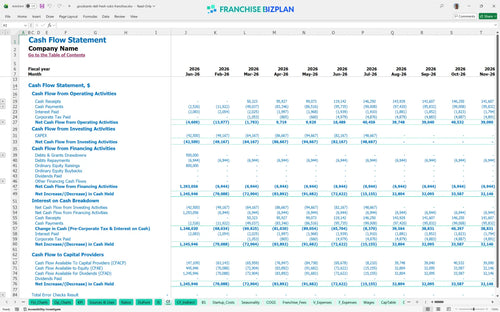
The lowest cash point occurs in July 2026, with a minimum cash requirement of $840,000 to handle the gap between build-out and full revenue maturity. You should maintain a buffer to handle the $11,000 monthly rent during the pre-opening phase. Cash is king during the first six months.
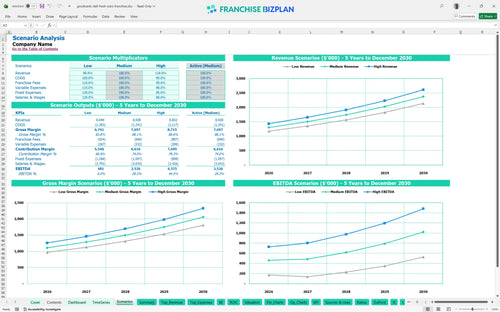
Moving from a medium to a high-revenue scenario significantly shifts your year-one margin. By hitting athletic contracts early, you can push revenue toward the $1.3M mark sooner, which drastically improves your cash runway and speeds up the 3-year payback timeline. Plan for the worst but execute for the best.
Finance: update unit break-even and payback model by Friday
This franchise unit financial model template is built in Excel with open formulas, allowing you to swap out assumptions for your specific territory. You can adjust everything from local labor rates to specific lease terms without breaking the math. Every cell is open for your local market tweaks.

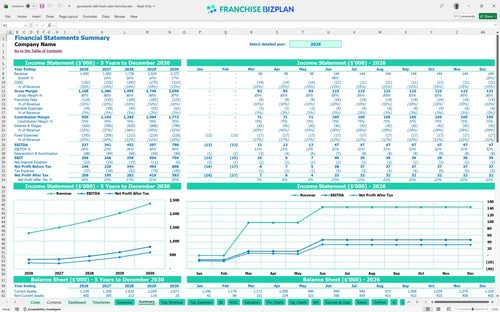
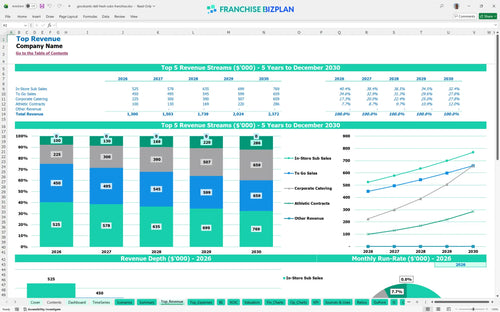
Map out your path from grand opening to a mature operation with detailed annual views. The model tracks revenue scaling from $1,300,000 in year one to over $2,372,000 by year five, giving you a clear view of future cash flow. Watch your cash flow evolve over sixty months.

Royalties and marketing funds are fixed obligations that impact your bottom line every single month. This model automatically calculates the 6% royalty and 3.5% brand fund contributions against your projected sales so there are no surprises at month-end. Royalties are a fixed reality of the system.

Before you sign a lease, you need to know the total capital requirement for your sub sandwich shop franchise model. We have included the $30,000 franchise fee plus $220,000 for leaseholds and $110,000 for kitchen gear to help you find your exact break-even point. Know your nut before you sign the lease.

Don't guess on your numbers when estimating profitability for sandwich shop franchises. The model includes benchmarks for food costs-starting around 12.8%-and labor to ensure your projections stay within industry norms for a deli concept. Compare your numbers to the rest of the street.


Simply purchase and download the financial model template, then access it instantly using Microsoft Excel or Google Sheets. No installation or technical expertise required-just open and start working.

Enter your business-specific numbers, including revenue projections, costs, and investment details. The pre-built formulas will automatically calculate financial insights, saving you time and effort.

Leverage the investor-ready format to confidently showcase your financial projections to banks, franchise representatives, or investors. Impress stakeholders with clear, data-driven insights and professional reports.

Leverage the investor-ready format to confidently present your projections to banks, franchise representatives, or investors.