
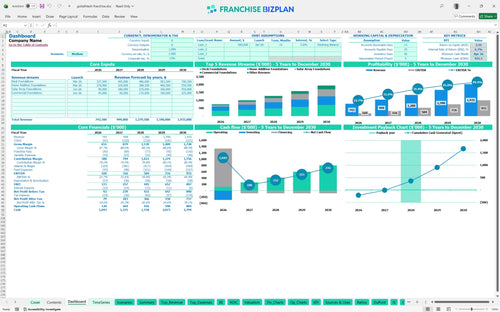
All-in-one Dashboard
Core inputs and core outputs


This financial model template for foundation installation business provides a complete roadmap for franchisees, covering everything from equipment CAPEX to five-year EBITDA growth.
Core inputs and core outputs
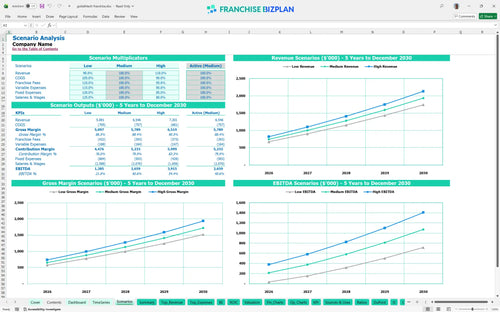
Three scenario analysis
Presentation ready
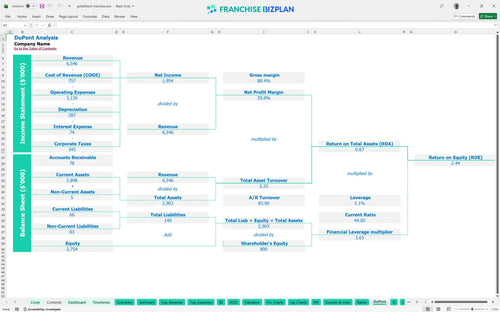
DuPont analysis
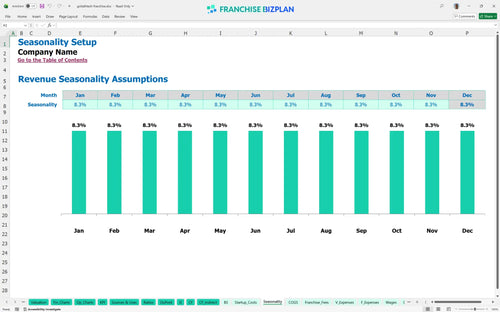
Researched revenue assumptions
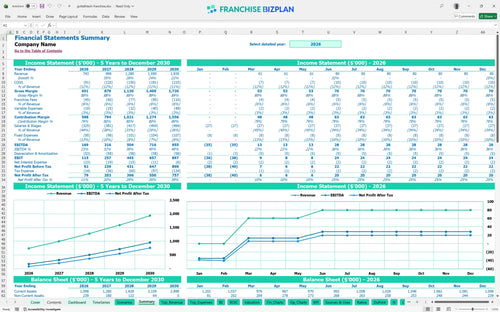
Lender-friendly financial outputs
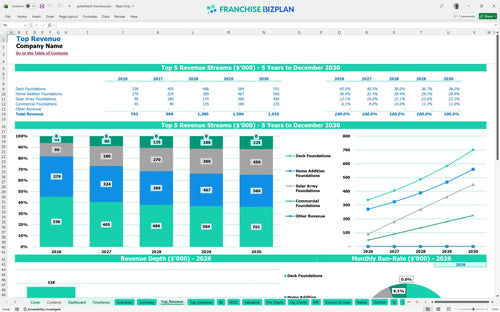
Revenue stream detailed view
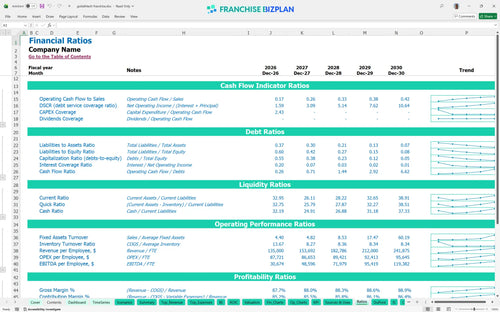
Performance metrics benchmark
We built this franchise unit financial model using our own research to provide a realistic view of the foundation installation sector. Key assumptions, including year one revenue of $743,000 and the 6% marketing fee, are pre-populated and fully editable to match your specific territory. This tool is among the best financial planning tools for new franchise owners looking for data-driven clarity.
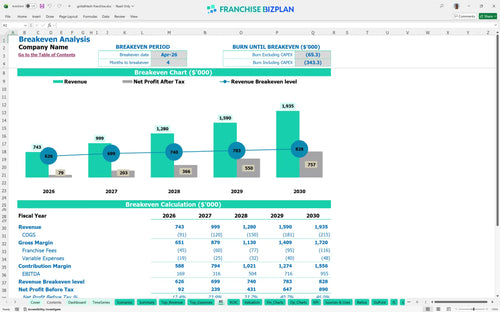
You can expect this unit to reach profitability quickly, with the model showing a break-even date in April 2026, just four months after launch. By year five, EBITDA is projected to reach $955,000 as you scale commercial and solar foundation contracts. Forecasting revenue for home foundation service franchise becomes easier as you track these shifting project mixes.
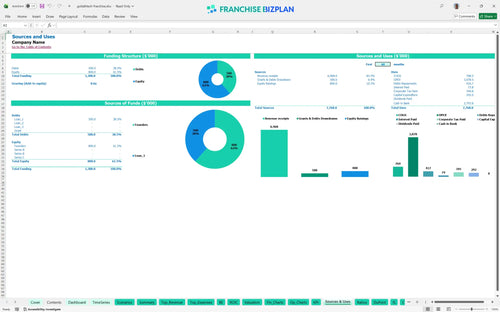
How to calculate startup costs for a construction franchise starts with identifying your heavy equipment needs. Launching this unit requires significant upfront capital, including $65,000 for installation equipment and $68,000 for trucks. Your total initial investment also covers the $49,500 franchise fee and $35,000 in leasehold improvements for your warehouse facility.
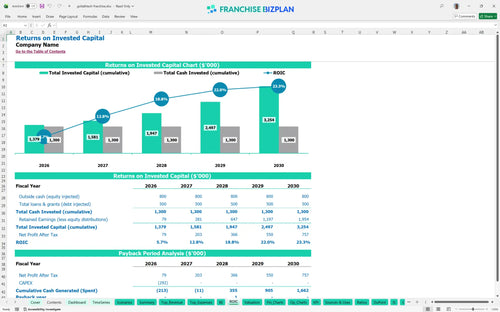
Calculating ROI for helical pile installation unit shows a 2.44 return on equity and an internal rate of return (IRR) of 6.66%. The model estimates a three-year payback period, which is a solid result for a business requiring a significant capital expenditure budget. Here is the quick math: your year-five EBITDA margin is projected to hit nearly 49%.
The unit hits its monthly break-even point in April 2026, which is remarkably fast for a construction-heavy model. Your ability to cover fixed costs like the $3,800 warehouse rent and $5,550 in monthly wages depends heavily on maintaining a steady volume of deck and home addition foundations. Every 1-point margin leak in material costs matters when you are scaling.
Your lowest cash point occurs in April 2026, with a minimum cash balance of $926,000. This suggests you need a substantial liquid buffer to handle the heavy equipment purchases and the initial four-month ramp-up period before cash flow turns positive. How to evaluate profitability of a construction franchise depends on managing this early-stage cash pressure.
Small business financial projection spreadsheet for franchisees allows for testing Low, Medium, and High cases. A 10% drop in revenue defintely delays your payback period, while hitting the High case through better local marketing execution could push Year 1 revenue past the $743,000 baseline. Scenarios help you map near-term risks to clear actions.
This franchise unit financial model template is built in Excel with open formulas, allowing you to adjust every variable for your specific territory. You can modify installation volumes, material costs, and local labor rates to see how they impact your bottom line. It serves as a flexible franchise business plan template that adapts to your specific market conditions.

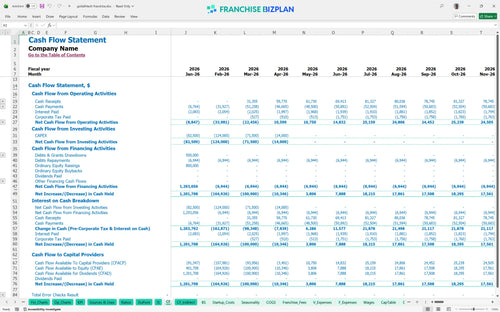
Map out your growth from year one through year five with detailed forecasts for revenue, expenses, and cash flow. This construction franchise investment analysis helps you visualize the transition from initial setup to a mature operation generating over $1.9M in annual sales. Long-term planning is simplified with an operational cash flow forecast that tracks your path to scale.

Track every dollar owed to the franchisor, from the initial $49,500 fee to ongoing obligations. While this specific model shows a 0% royalty, it accounts for a 6% marketing fund contribution that hits your top line immediately. Understanding the franchise royalty fee structure is essential for calculating your true store-level margin.

Use this franchise profitability calculator to estimate your total entry cost, including $68,000 for pickup trucks and $65,000 for installation equipment. Knowing your franchise unit break-even point calculation is vital for managing your early-stage runway. This tool helps you see exactly when your foundation business starts paying for itself.

Compare your foundation business performance against industry standards for labor and materials. The model includes pre-set ranges for helical pile materials and installation supplies to ensure your startup costs for foundation business stay within realistic bounds. Use these benchmarks to sanity-check your profit margin analysis for heavy equipment installation business.


Simply purchase and download the financial model template, then access it instantly using Microsoft Excel or Google Sheets. No installation or technical expertise required-just open and start working.

Enter your business-specific numbers, including revenue projections, costs, and investment details. The pre-built formulas will automatically calculate financial insights, saving you time and effort.

Leverage the investor-ready format to confidently showcase your financial projections to banks, franchise representatives, or investors. Impress stakeholders with clear, data-driven insights and professional reports.

Leverage the investor-ready format to confidently present your projections to banks, franchise representatives, or investors.