
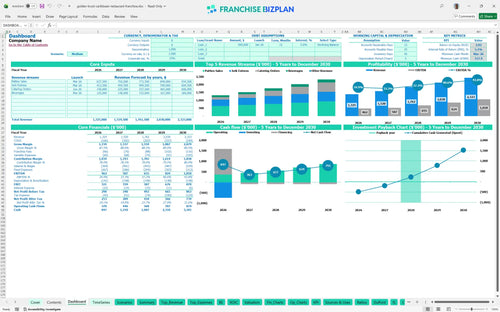
All-in-one Dashboard
Core inputs and core outputs


This financial template for fast-casual restaurant business plan provides a complete roadmap for a Caribbean unit, covering everything from initial build-out to five-year EBITDA growth.
Core inputs and core outputs
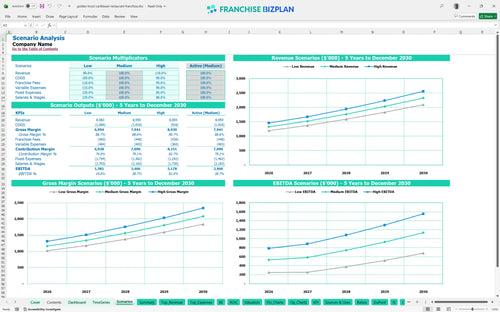
Three scenario analysis
Presentation ready
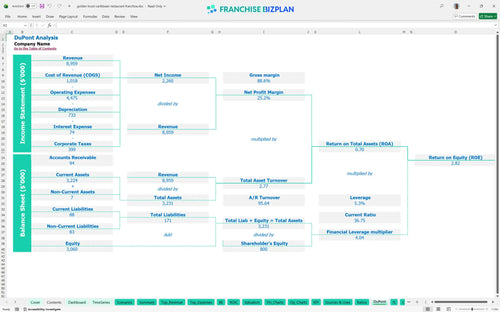
DuPont analysis
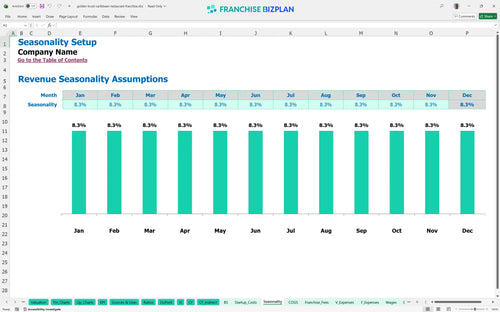
Researched revenue assumptions
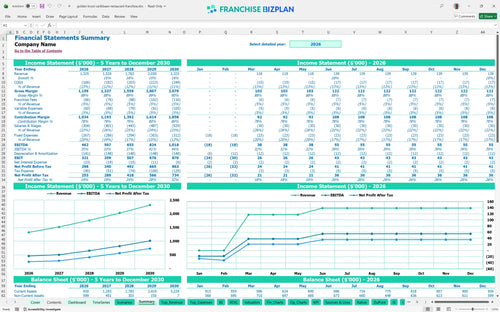
Lender-friendly financial outputs
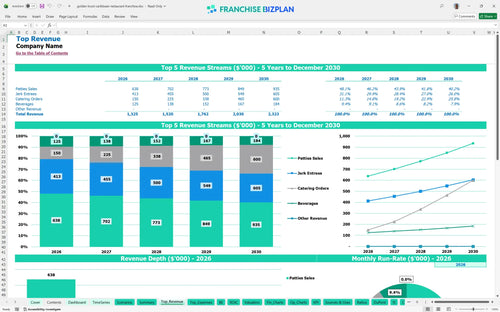
Revenue stream detailed view
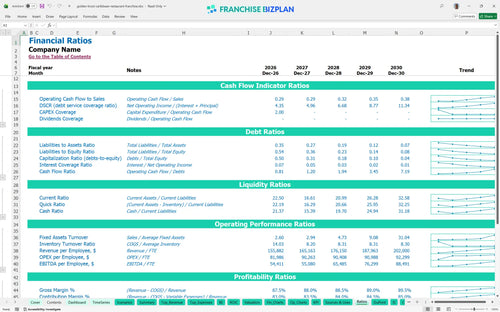
Performance metrics benchmark
We built this franchise unit financial model using our own research to help you navigate the Caribbean dining space. Key assumptions like the 3% royalty fee and $16,000 monthly rent are pre-populated with researched data and are fully editable. Here's the quick math: with year-one revenue at $1,325,000, your operating expenses for restaurants must be tightly managed to hit your $462,000 EBITDA target.
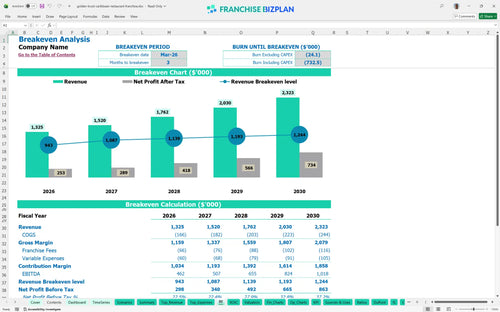
Based on our Caribbean food franchise profitability projections, you should see black ink by March 2026. This assumes you hit your $1.32M year-one revenue target while keeping food ingredients at 11% and royalties at 3%. Speed to profit is the only metric that matters.
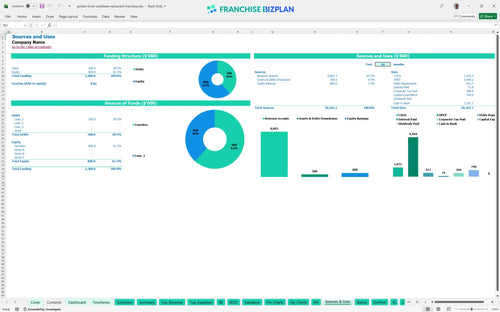
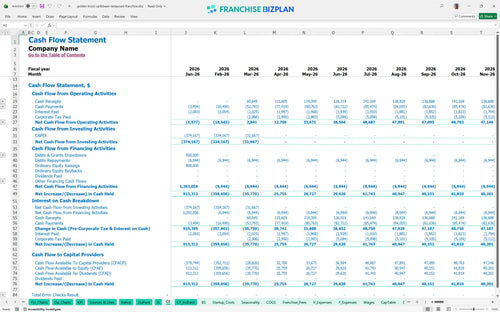
You will need significant capital expenditure planning to get the doors open, with a total investment covering the $40,000 franchise fee and $320,000 in leaseholds. The model suggests a minimum cash position of $518,000 to navigate the early months safely. Capital is fuel; don't run out mid-journey.
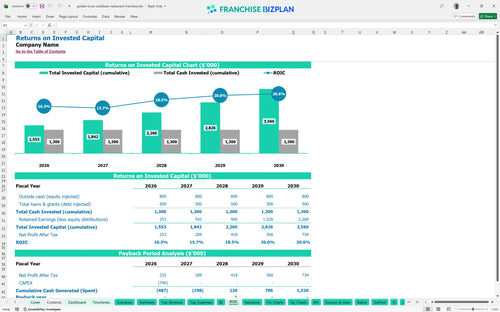
This unit shows a 5.14% IRR and a 3-year payback period, which is solid for a high-CAPEX food concept. Use this franchise investment return calculator for restaurant owners to see how EBITDA hitting $1,018,000 by year five boosts your returns. ROI is the ultimate scorecard for any owner.
You hit break-even in month 3, provided you maintain steady traffic for patties and jerk entrees. Rent at $16,000 a month is your biggest fixed hurdle, so tracking key performance indicators for fast-casual restaurant franchises like peak-hour throughput is vital. Break-even is your first real victory.
Your lowest cash point hits in March 2026 at $518,000 while estimating operating costs for a new franchise location. While the ramp-up is fast, you defintely need a buffer to handle the gap between paying $740k+ in startup costs and seeing consistent deposits. Cash is king, but runway is the kingdom.
This franchise unit financial feasibility study template lets you test how a 10% drop in patty sales or a spike in food costs impacts your $462k year-one EBITDA. Moving to a high-performance case by smashing catering targets can pull your payback period well under three years. Plan for the worst, but execute for the best.
This Excel-based tool lets you tweak every variable for your Caribbean restaurant, from patty sales volume to local labor rates. You can swap out the pre-filled assumptions to see how a different zip code or smaller footprint changes your bottom line instantly. Control your numbers before they control you.

Map out your growth from a $1.32M start to over $2.3M in annual sales by year five using detailed restaurant revenue forecasting. This model tracks your long-term trajectory, ensuring you see the impact of scaling catering orders and beverage sales over a half-decade horizon. Five years is a lifetime in food service.

Don't let the 3% royalty and 2% marketing fee surprise you; this model bakes them directly into your monthly cash flow for this fast casual franchise investment. It accounts for the $40,000 initial fee and ongoing brand fund contributions so you know exactly what stays in your pocket. Royalties are a permanent tax on your hustle.

How to calculate startup costs for a Caribbean restaurant franchise becomes simple when you see the $320,000 for leasehold improvements and $130,000 for kitchen gear mapped out. This template shows you the exact sales volume needed to cover these costs and hit your break-even point. Knowing your floor is as vital as your ceiling.

We've included benchmarks for food costs, which we see dropping from 11% to 9% as you scale your Caribbean restaurant. Use these numbers to sanity-check your rent and labor spend against typical fast-casual performance standards. Don't guess when you can benchmark.


Simply purchase and download the financial model template, then access it instantly using Microsoft Excel or Google Sheets. No installation or technical expertise required-just open and start working.

Enter your business-specific numbers, including revenue projections, costs, and investment details. The pre-built formulas will automatically calculate financial insights, saving you time and effort.

Leverage the investor-ready format to confidently showcase your financial projections to banks, franchise representatives, or investors. Impress stakeholders with clear, data-driven insights and professional reports.

Leverage the investor-ready format to confidently present your projections to banks, franchise representatives, or investors.