
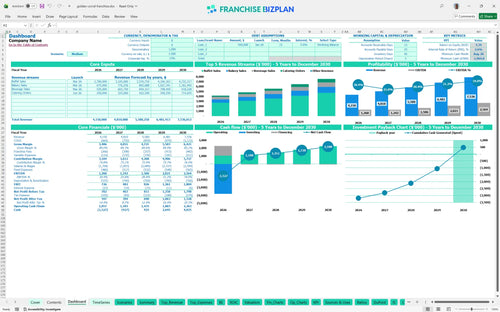
All-in-one Dashboard
Core inputs and core outputs


This comprehensive Excel template provides a data-driven framework for analyzing startup costs, 5-year profitability, and cash flow requirements for a high-volume buffet franchise unit.
Core inputs and core outputs
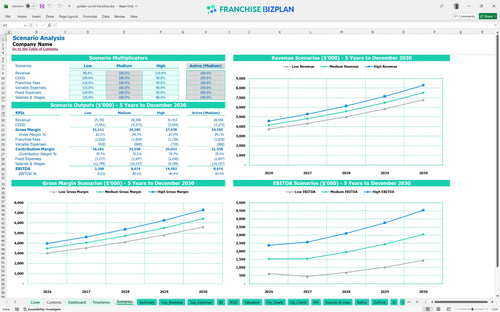
Three scenario analysis
Presentation ready
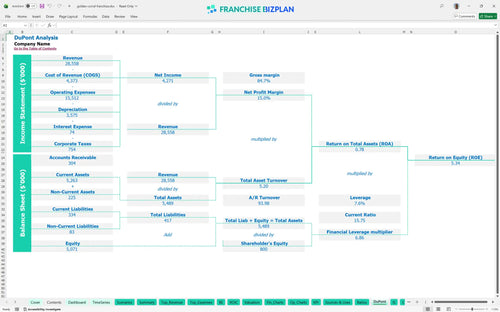
DuPont analysis
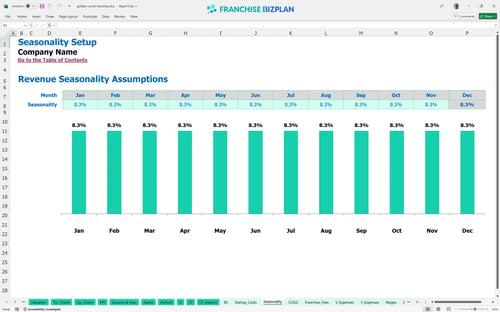
Researched revenue assumptions
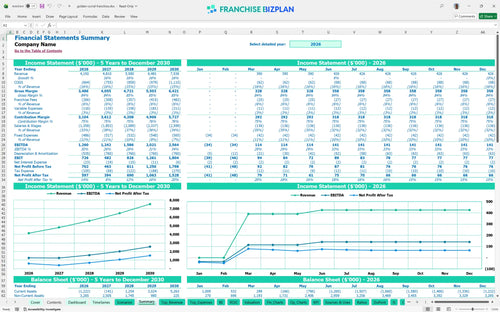
Lender-friendly financial outputs
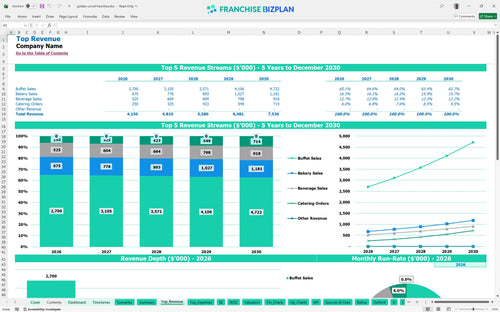
Revenue stream detailed view
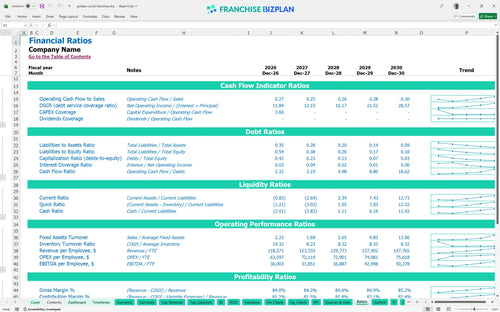
Performance metrics benchmark
We built this franchise unit financial model using extensive research into high-volume buffet operations and standard brand requirements. The pre-populated assumptions for revenue streams, like the $4.15M year-one target, and expenses such as the $50,000 initial franchise fee are fully editable to reflect your specific market conditions. This model defintely gives you a professional-grade starting point for your financial forecasting for high-volume restaurant locations.
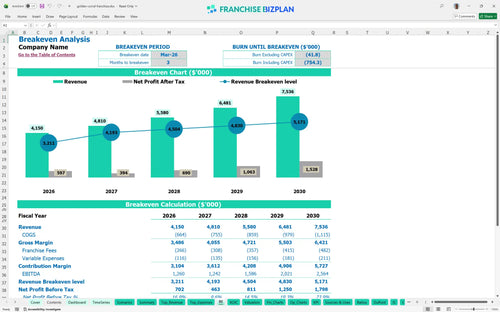
The unit reaches operational profitability very quickly, with a projected breakeven date in March 2026, just three months after launch. This rapid start is driven by high-volume buffet sales and a disciplined approach to food costs, which start at 14% of revenue. By year three, the model shows an EBITDA of $1.58M after accounting for all royalties and fixed costs.
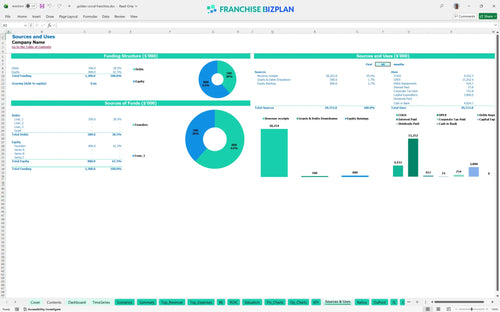
Launching this unit requires a significant restaurant capital investment, primarily focused on the $1.8M for leasehold improvements and $750,000 for kitchen equipment. Total startup costs exceed $3.8M when you include furniture, signage, and the initial franchise fee. The model tracks these as CAPEX items to help you manage your cash runway during the build-out phase.
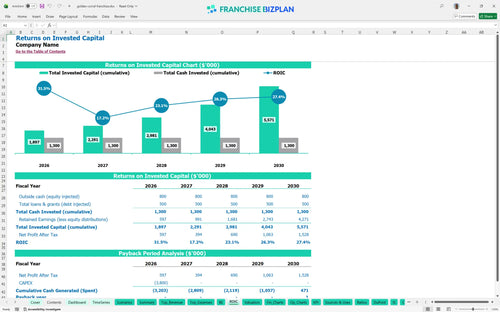
The franchise investment return on investment calculator shows a 5-year payback period and an Internal Rate of Return (IRR) of 2.64%. While the initial capital outlay is high, the steady climb in revenue to $7.5M by year five supports a Return on Equity (ROE) of 5.34%. This reflects the long-term stability of the high-volume buffet model rather than a quick-flip scenario.
The monthly break-even point is reached in month 3, assuming you hit your initial revenue targets of approximately $345,000 per month. The biggest driver for break-even is managing the $28,000 monthly rent and the high labor cost of 45+ staff members. If volume dips, your restaurant franchise profit margin analysis will show immediate pressure due to these high fixed costs.
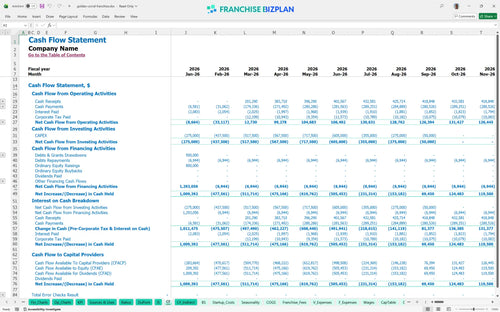
The lowest cash point occurs in August 2026 at -$1.965M, reflecting the heavy upfront investment before the unit reaches full maturity. You need to ensure your financing covers this gap plus a buffer for unexpected delays in construction or permitting. Managing the timing of equipment payments and leasehold draws is critical to protecting your liquidity during the ramp-up.
In a high-growth scenario where revenue hits the $7.5M mark by year five, EBITDA margins expand significantly as fixed costs like rent are diluted. Conversely, a low-revenue scenario would extend the payback period beyond five years and could lead to a deeper cash trough in year one. The model allows you to test these variables to see how sensitive your ROI is to changes in food costs or guest traffic.
Finance: update unit break-even and payback model by Friday
This franchise financial model template is built in Excel to give you total control over your unit-level planning. You can adjust pre-filled formulas and editable assumptions to match your specific territory, whether you are looking at a single high-volume location or a multi-unit expansion. It simplifies the process of creating a buffet franchise business plan by letting you tweak everything from guest counts to food waste percentages.

Planning for a high-volume restaurant requires a long-term view of how margins shift as the unit matures. This model provides detailed 5-year restaurant franchise financial projections, covering annual revenue growth from $4.15M in year one to over $7.5M by year five. You get a clear look at how cash flow and store-level profits evolve as you scale operations and optimize your food service revenue forecasting.

The model specifically tracks the financial weight of your brand obligations to ensure your franchise unit P&L statement remains accurate. It accounts for the 4% royalty fee and the 2.4% marketing fund contribution based on gross sales, helping you see the impact of these costs on your bottom line. Analyzing franchise royalty and marketing fund costs is essential for understanding how much cash actually stays in your pocket after the franchisor takes their cut.

Estimating the total capital needed for a large-scale buffet is complex, but this tool simplifies how to calculate startup costs for a restaurant franchise. It breaks down the initial investment into clear categories like leasehold improvements and kitchen equipment, while the restaurant franchise break-even analysis spreadsheet identifies the exact month you stop burning cash. You will know exactly what sales volume is required to cover your $28,000 monthly rent and other fixed overheads.

We have integrated real-world data points to help you perform a realistic franchise unit profitability analysis against industry standards. The model includes benchmarks for labor costs, which are significant in a high-touch buffet environment, and occupancy costs like property taxes and insurance. These built-in metrics allow you to sanity-check your operating budget template for retail food franchises and ensure your projections aren't overly optimistic.


Simply purchase and download the financial model template, then access it instantly using Microsoft Excel or Google Sheets. No installation or technical expertise required-just open and start working.

Enter your business-specific numbers, including revenue projections, costs, and investment details. The pre-built formulas will automatically calculate financial insights, saving you time and effort.

Leverage the investor-ready format to confidently showcase your financial projections to banks, franchise representatives, or investors. Impress stakeholders with clear, data-driven insights and professional reports.

Leverage the investor-ready format to confidently present your projections to banks, franchise representatives, or investors.