
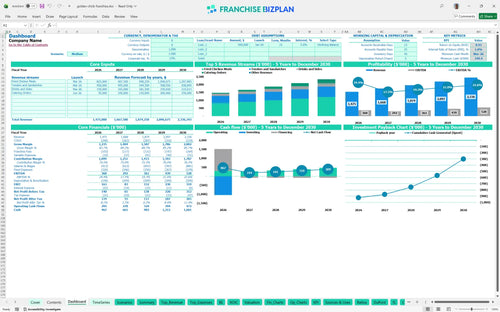
All-in-one Dashboard
Core inputs and core outputs


The restaurant franchise operating budget template provides a complete financial toolkit including P&L, cash flow, and CAPEX schedules specifically for a high-volume chicken unit.
Core inputs and core outputs
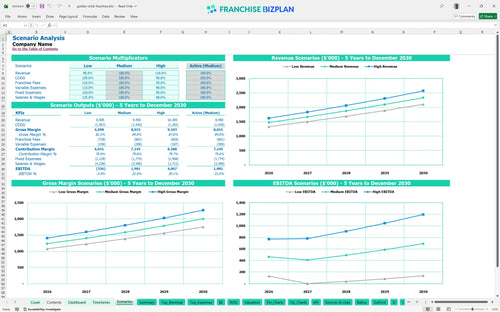
Three scenario analysis
Presentation ready
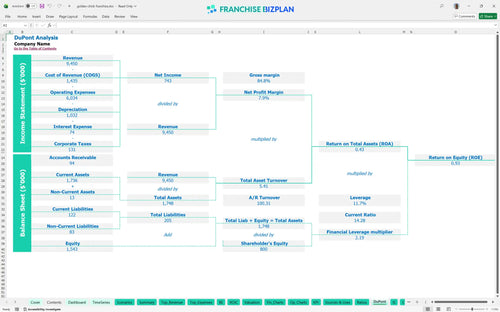
DuPont analysis
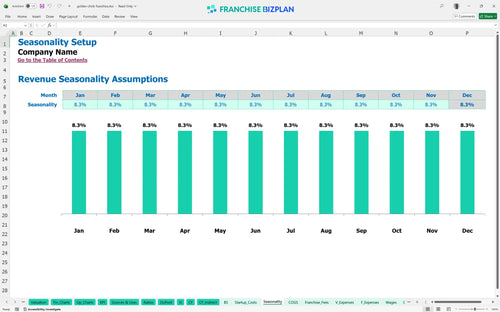
Researched revenue assumptions
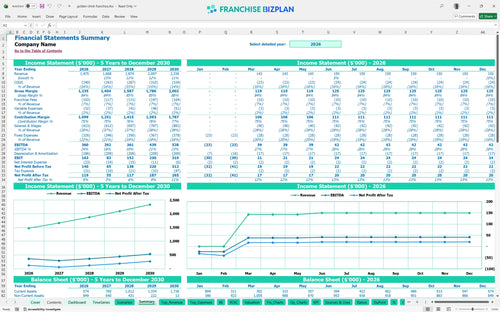
Lender-friendly financial outputs
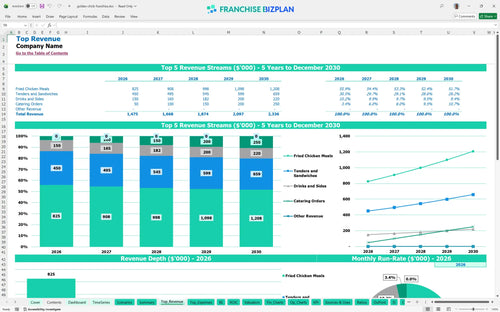
Revenue stream detailed view
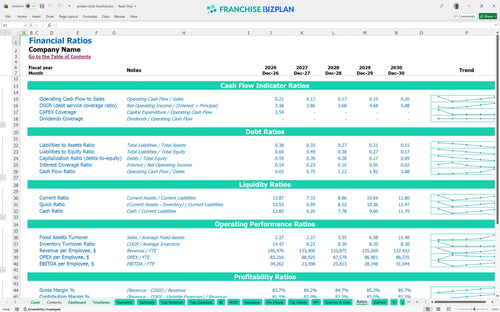
Performance metrics benchmark
We built this franchise unit financial model using our own research to ensure it reflects real-world operational demands. Key assumptions like the $1.47M year-one revenue and the $18,000 monthly rent are pre-populated and fully editable to match your specific territory. This model provides a clear look at the $360,000 initial EBITDA and the path to scaling your chicken franchise unit.
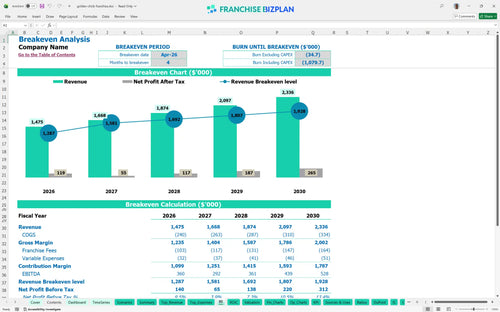
You can expect this unit to hit monthly profitability by April 2026, just four months after the March launch. While first-year EBITDA is strong at $360,000, the model shows a slight dip in year two as you scale the team before climbing steadily toward $528,000 by year five.
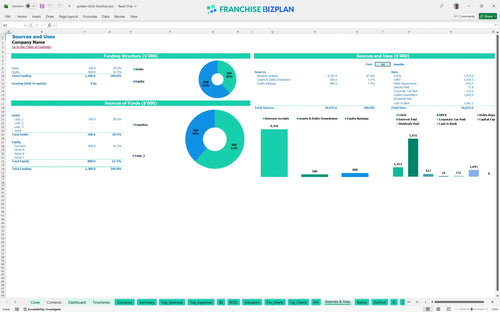
To get the doors open, you will need a total investment of $1,045,000 plus a cash buffer. This covers the $30,000 franchise fee and heavy infrastructure like the $100,000 drive-thru setup and $450,000 in build-out costs for your flagship location.
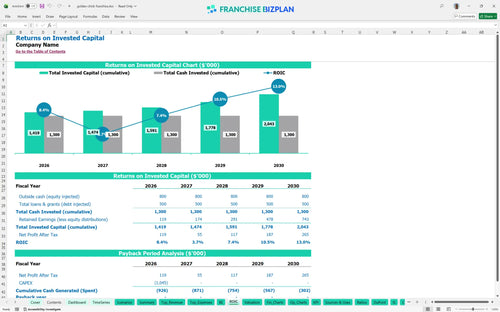
This project offers a 1.77% return on investment (IRR) over five years, with a full payback occurring shortly after the five-year mark. While the initial cash outlay is high, the steady growth in unit economics suggests a stable long-term asset, though the ROE sits at 0.93.
You need to reach break-even within four months of opening to stay on track with your restaurant franchise business plan. The main driver for this is the high $18,000 monthly rent; you will need consistent daily traffic across fried chicken meals and sandwiches to cover these fixed occupancy costs.
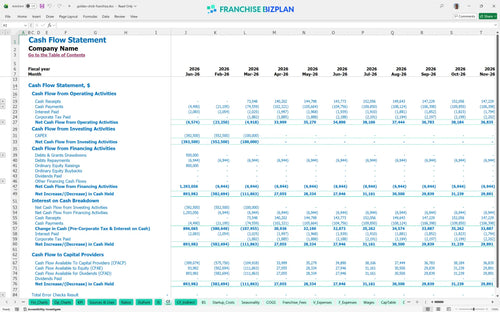
Your lowest cash point hits in March 2026 at $199,000, which is the same month operations start. To be fair, you defintely need to keep a close eye on the pre-opening marketing spend of $25,000 to ensure you do not dip below your minimum cash requirements during the ramp-up.
In a franchise profitability analysis, the 'High' scenario assumes aggressive catering growth and lower food costs. A 'Low' scenario with weak drive-thru traffic could push the payback period well beyond year six and increase the peak cash need during the first winter, so use the franchise profitability analysis template to test both.
This franchise financial model is fully customizable in Excel, allowing you to tweak every variable from chicken meal prices to hourly crew wages. You get pre-filled formulas and editable assumptions that make it easy to adapt this financial model for new restaurant location to specific Gilbert market scenarios. It is basically a fast food restaurant financial model excel that does the heavy lifting for you.

Planning for a single unit requires a multi-year view to see how catering and drive-thru volume compound over time. This fast food franchise financial projections tool maps out five years of revenue, scaling from $1.47M in year one to over $2.3M by year five. It serves as a comprehensive QSR franchise financial forecasting guide for your long-term cash flow planning.

Every dollar counts when you are paying a 4% royalty and a 3% marketing fee on gross sales. The model simplifies estimating franchise royalty and marketing fees alongside the initial $30,000 entry cost, ensuring you understand exactly how much goes to the brand and how much stays in your pocket. Tracking these royalty fees is vital for maintaining your store-level margins.

Opening a high-volume unit requires significant capital expenditure, including $450,000 for leasehold improvements and $250,000 for kitchen equipment. This tool helps you how to calculate franchise startup costs and identifies the exact sales volume needed to cover your $18,000 monthly rent. Knowing your total franchise startup costs prevents mid-build funding gaps.

We include industry standards for labor and food costs so you can see if your 14.5% ingredient cost is competitive. Using this restaurant franchise unit economics spreadsheet, you can compare your projected EBITDA against other chicken concepts to ensure your site selection is on target. These benchmarks act as a sanity check for your localized assumptions.


Simply purchase and download the financial model template, then access it instantly using Microsoft Excel or Google Sheets. No installation or technical expertise required-just open and start working.

Enter your business-specific numbers, including revenue projections, costs, and investment details. The pre-built formulas will automatically calculate financial insights, saving you time and effort.

Leverage the investor-ready format to confidently showcase your financial projections to banks, franchise representatives, or investors. Impress stakeholders with clear, data-driven insights and professional reports.

Leverage the investor-ready format to confidently present your projections to banks, franchise representatives, or investors.