
All-in-one Dashboard
Core inputs and core outputs


This Excel template for restaurant unit economics provides a complete, data-driven toolkit to forecast revenue, expenses, and investor returns for a new pizza franchise location.
Core inputs and core outputs
Three scenario analysis
Presentation ready
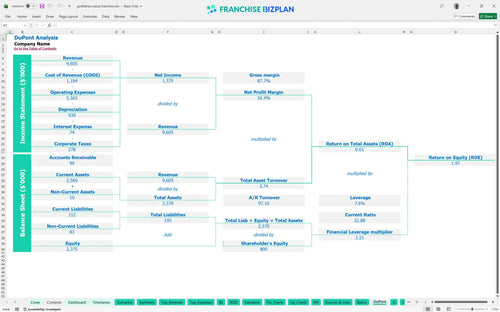
DuPont analysis
Researched revenue assumptions
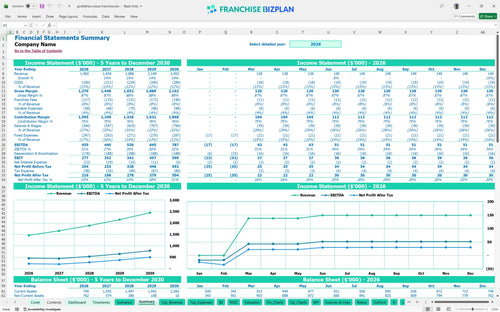
Lender-friendly financial outputs
Revenue stream detailed view
Performance metrics benchmark
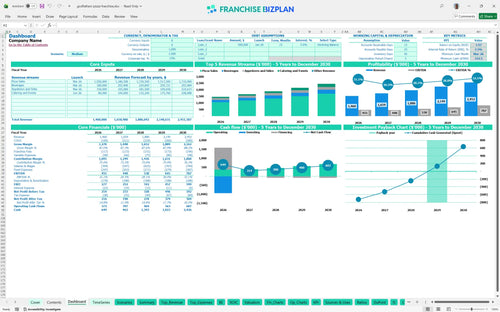
We built this pizza shop financial feasibility study using deep research into the operational realities of high-volume pizza units. Key assumptions-including the $1.46M year-one revenue, 11% ingredient costs, and specific staffing for pizza cooks-are pre-populated and fully editable. This model provides the data-driven clarity you need to evaluate the investment and manage daily store-level margins effectively.
Profitability arrives quickly, with the unit reaching its break-even point by March 2026, just three months after the doors open. With a year-one EBITDA of $455,000, the model shows that the concept can generate strong cash flow early, provided you manage the 11% food cost and 8% total franchise fees. Efficiency in the kitchen and high throughput during the lunch rush are the primary drivers for these healthy margins.
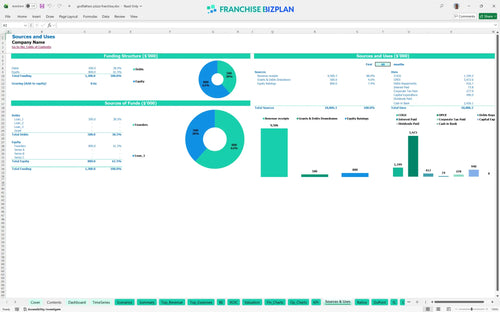
Launching this pizza unit in a prime US location requires an estimated total investment of $940,000. This capital covers the $25,000 initial franchise fee, a $450,000 store build-out, and $250,000 for specialized kitchen equipment like high-volume ovens. This is a comprehensive guide on how to calculate startup costs for a pizza franchise while maintaining a safe cash buffer for the first few months.
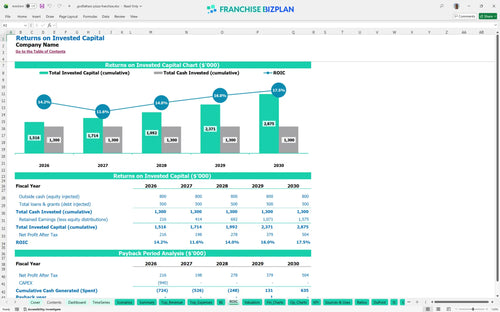
The franchise investment ROI calculator indicates an Internal Rate of Return (IRR) of 3.52% and a Return on Equity (ROE) of 1.97. While the initial years focus on recouping the $940,000 investment, the payback period is estimated at 4 years. This timeline is standard for a high-CAPEX restaurant model where long-term equity growth and consistent EBITDA are the primary goals for the operator.
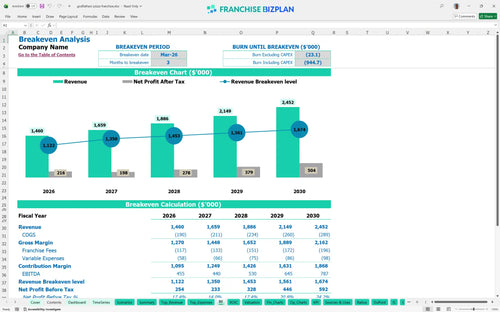
The franchise unit cash flow forecasting template identifies March 2026 as your break-even month. The main hurdle is the $15,000 monthly rent for a prime location, which requires steady daily traffic and a healthy average ticket. Reaching this point quickly depends on your ability to ramp up pizza sales to the $700,000 annual level and launch catering services by June 2026.
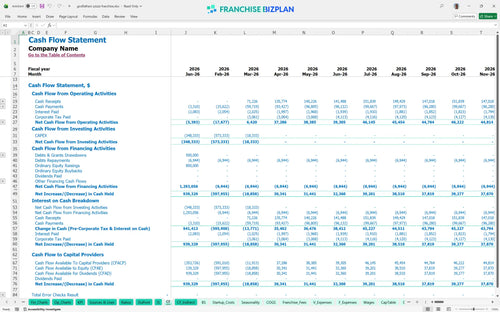
The lowest cash point occurs in March 2026, with a minimum cash balance of $323,000 remaining in the business. This indicates you need a significant liquidity buffer to survive the pre-opening phase and the initial three-month ramp-up. You will defintely want to keep a close eye on fixed expenses like the $1,400 property insurance and $15,000 rent during this critical window.
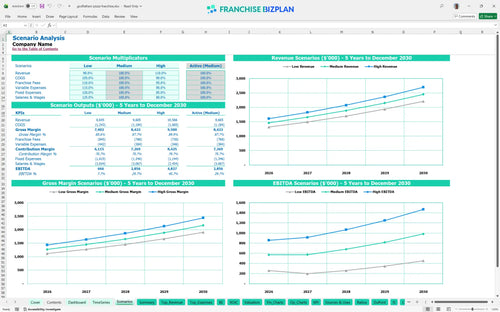
The financial model for multi-unit restaurant operations allows you to test how different sales volumes impact your 4-year payback. In the base case, revenue grows from $1.46M to $2.45M, but a high-performance scenario-driven by superior local marketing and high retention-can significantly increase your IRR. Conversely, a low-sales scenario would extend the payback period and require tighter control over the $72,000 manager salary.
Finance: update unit break-even and payback model by Friday.
This franchise financial model template is built in Excel with an open architecture, allowing you to modify every variable to fit your specific market. The editable assumptions and pre-filled formulas make it easy to adjust for local labor laws, specific lease terms, or varying vendor prices. It is a flexible franchise unit economic model that adapts to your unique territory and operating scenario.

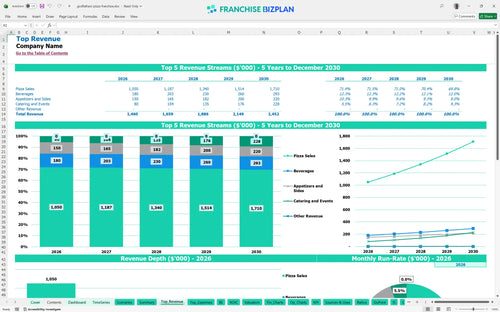
Success in the pizza industry requires a long-term view of growth and capital recycling. This model provides detailed 5-year food and beverage financial projections, tracking your journey from an initial $1.46M in year-one sales to $2.45M by year five. You can monitor how store-level margins evolve as you scale catering and delivery operations in a competitive urban market.

This model simplifies analyzing franchise royalty and marketing fund costs by automating the calculations for your ongoing obligations. It factors in the 6% royalty fee and 2% marketing fund contribution against your monthly gross sales to show true net performance. Estimating labor and food costs for franchise units alongside these fees ensures you understand the real-world cash left for the owner.

Building a pizza franchise business plan requires a precise map of your initial capital outlay and the path to self-sufficiency. This restaurant business model financial spreadsheet tracks the $25,000 franchise fee and $450,000 build-out, identifying exactly when your monthly revenue covers the $15,000 rent and other fixed costs. It provides a clear break-even analysis for franchises to help you manage early-stage risk.

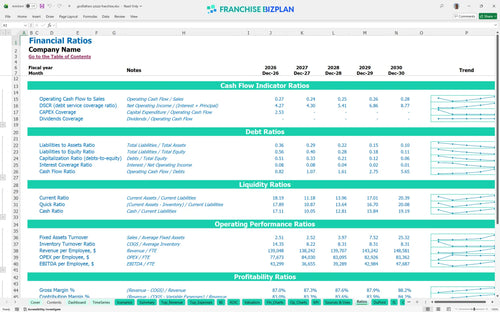
Use our built-in benchmarks to perform a rigorous restaurant profit margin analysis and sanity-check your operating assumptions. We've included researched standards for food costs, such as the 11% target for dough and cheese, to help you stay competitive. These metrics are essential for capital expenditure planning and ensuring your unit performs within the expected ranges for high-volume pizza concepts.


Simply purchase and download the financial model template, then access it instantly using Microsoft Excel or Google Sheets. No installation or technical expertise required-just open and start working.

Enter your business-specific numbers, including revenue projections, costs, and investment details. The pre-built formulas will automatically calculate financial insights, saving you time and effort.

Leverage the investor-ready format to confidently showcase your financial projections to banks, franchise representatives, or investors. Impress stakeholders with clear, data-driven insights and professional reports.

Leverage the investor-ready format to confidently present your projections to banks, franchise representatives, or investors.