
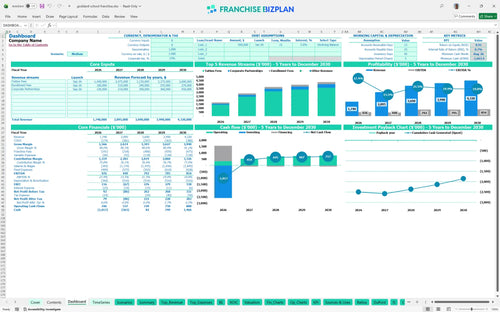
All-in-one Dashboard
Core inputs and core outputs


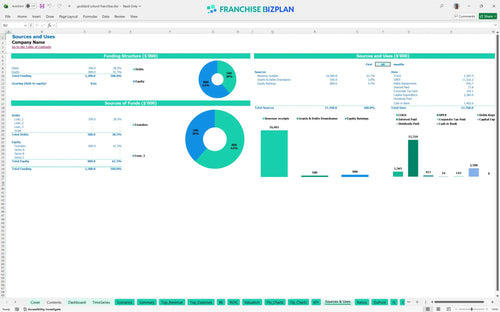
This preschool franchise investment financial spreadsheet provides a complete toolkit for forecasting revenue, managing payroll for 11+ teachers, and tracking a $2.58 million initial capital outlay.
Core inputs and core outputs
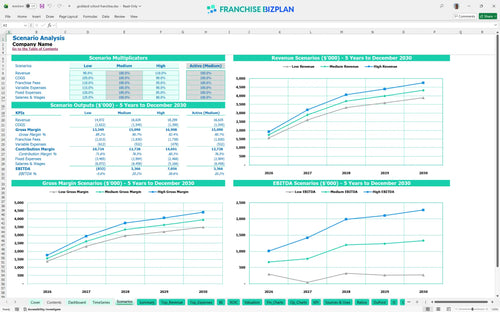
Three scenario analysis
Presentation ready
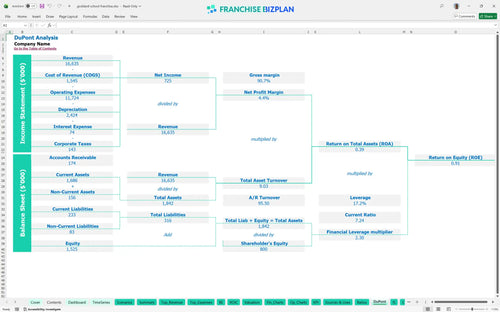
DuPont analysis
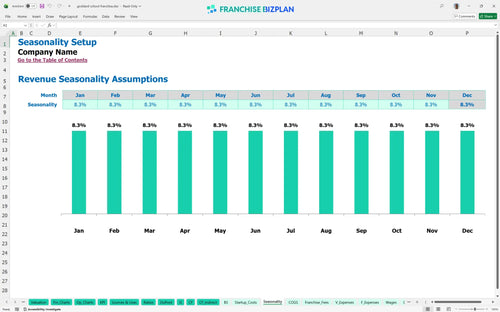
Researched revenue assumptions
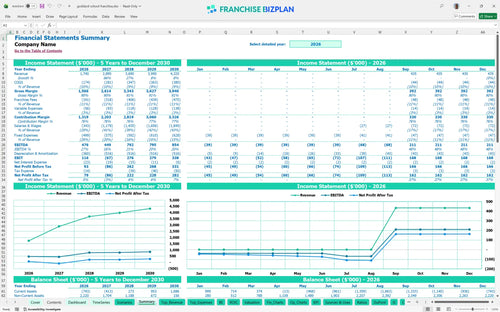
Lender-friendly financial outputs
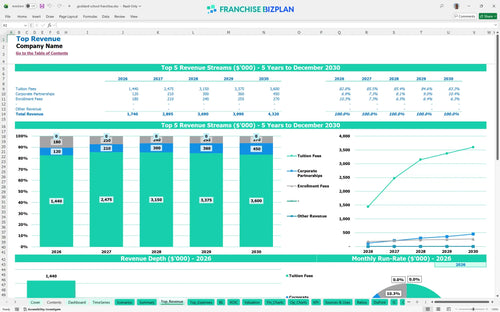
Revenue stream detailed view
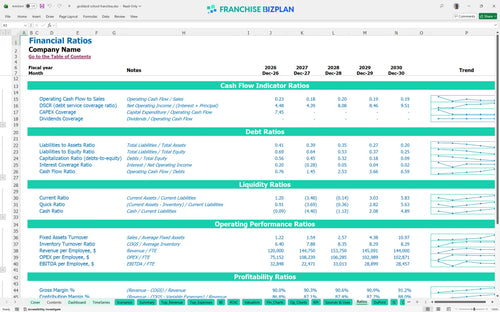
Performance metrics benchmark
We built this franchise unit financial model based on deep research into premium early childhood education economics. The assumptions for tuition fees, starting at $960,000 in year one, and fixed costs like the $28,000 monthly rent are pre-populated but fully editable. This tool helps you navigate the financial feasability study for childcare centers by mapping out a path to an $854,000 EBITDA by year five.
Profitability starts in year one with an initial EBITDA of $476,000, though net cash flow remains tight early on due to heavy upfront investment. By year three, revenue hits $3.69 million, and EBITDA jumps to $792,000 as enrollment stabilizes. Growth is steady, but the first 24 months require focus.
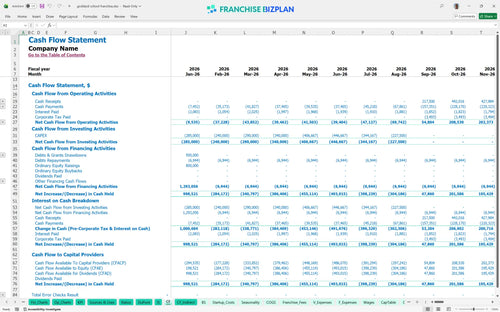
You need significant liquidity to launch, with the lowest cash point hitting negative $1,663,000 in August 2026. This startup budget template for premium preschool franchise covers the $135,000 franchise fee and $1.2 million for leasehold improvements. You are building a high-value asset, not just a classroom.
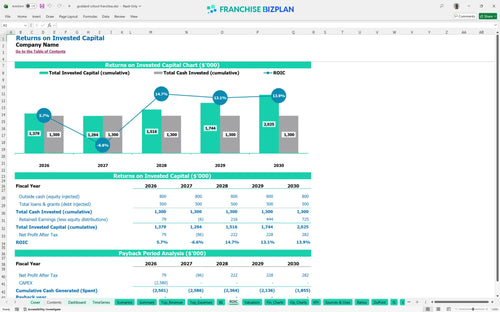
Evaluating profitability of early childhood education franchises requires looking past simple margins to long-term value. This model shows an internal rate of return (IRR) of 67% and a return on equity (ROE) of 91%. Patience pays off with a 67% internal rate of return.
The unit reaches its break-even point in September 2026, roughly 9 months after the initial capital outlays begin. The primary driver for hitting this milestone is tuition volume, as fixed costs like the $28,000 monthly rent create a high floor. Volume is your best friend for hitting break-even.
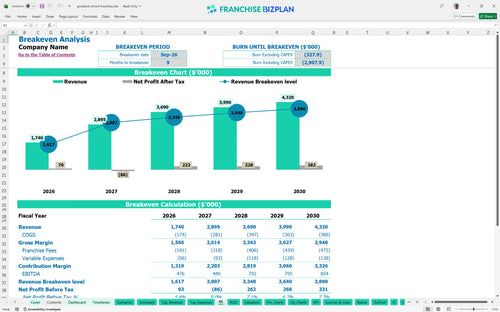
Your tightest spot is August 2026, where the cumulative cash outflow hits $1.663 million before revenue ramps up. You need a robust cash buffer to survive the build-out and initial hiring phase before tuition revenue starts flowing. Cash is king, especially during the build-out phase.
Best practices for franchise unit financial forecasting involve testing Low, Medium, and High cases. A 10% drop in enrollment in the Low case can push the break-even date back and increase peak cash needs. Planning for the worst helps you achieve the best.
Finance: update unit break-even and payback model by Friday
This franchise financial model is a flexible Excel tool built for precision and speed. You can adjust pre-filled formulas and editable assumptions to fit your specific territory, local labor rates, or real estate costs. It's a plug-and-play tool for complex planning.

Planning for the long haul is critical when managing a premium preschool franchise. Our model provides a detailed 5-year outlook, showing revenue growing from $1.74 million in year one to $4.32 million by year five. Five years of data keeps your bank and partners happy.

Analyzing daycare franchise royalty and fee structure is vital for protecting your store-level margins. This model tracks the 7% royalty and 4% marketing fee against your monthly tuition revenue so you see the real cash remaining. Fees are the cost of doing business; track them early.

Knowing how to calculate startup costs for a preschool franchise prevents mid-project cash crunches. The model includes a break-even point calculation, showing you hit the milestone in September 2026, just 9 months after launch. Knowing your zero-day is the best way to sleep at night.

We include benchmarks for education franchises to help you sanity-check your operating expenses. For example, the model accounts for educational materials starting at 5.5% of revenue and scaling down as you grow. Benchmarks keep your assumptions from getting too optimistic.


Simply purchase and download the financial model template, then access it instantly using Microsoft Excel or Google Sheets. No installation or technical expertise required-just open and start working.

Enter your business-specific numbers, including revenue projections, costs, and investment details. The pre-built formulas will automatically calculate financial insights, saving you time and effort.

Leverage the investor-ready format to confidently showcase your financial projections to banks, franchise representatives, or investors. Impress stakeholders with clear, data-driven insights and professional reports.

Leverage the investor-ready format to confidently present your projections to banks, franchise representatives, or investors.