
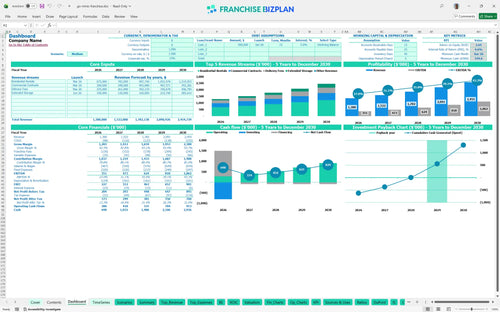
All-in-one Dashboard
Core inputs and core outputs


This small business financial projection template includes a capital expenditure budget, cash flow modeling, and a detailed ROI forecasting tool designed for portable storage operators.
Core inputs and core outputs
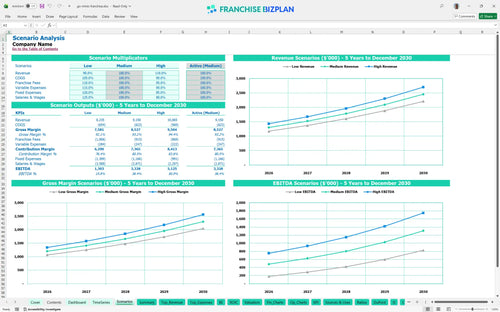
Three scenario analysis
Presentation ready
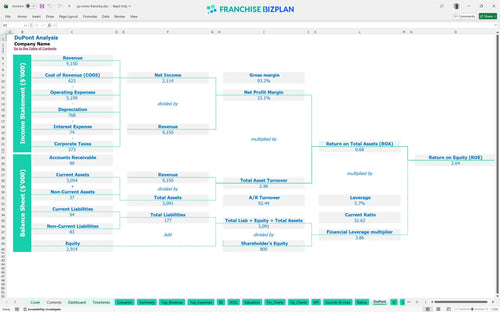
DuPont analysis
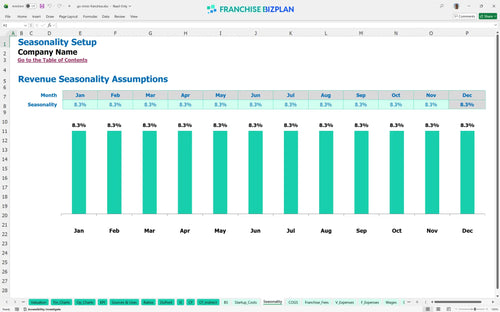
Researched revenue assumptions
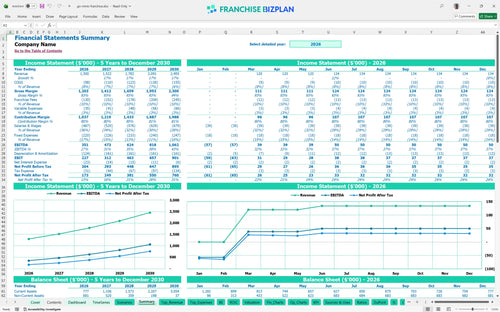
Lender-friendly financial outputs
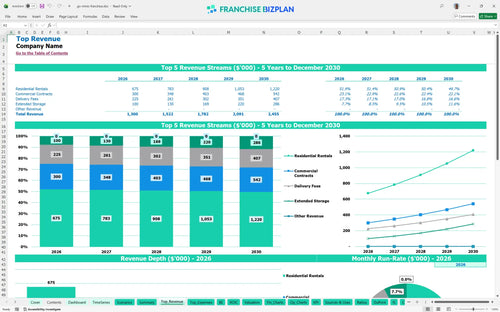
Revenue stream detailed view
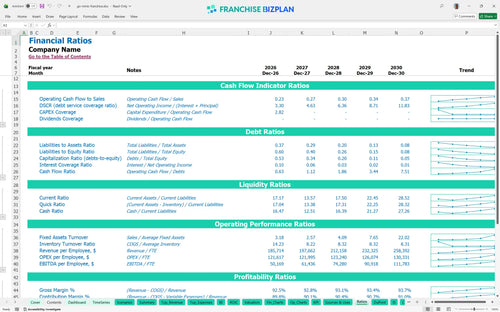
Performance metrics benchmark
We built this portable storage franchise business plan using deep research into the unit economics of mobile storage operations. The model comes pre-populated with $1.3 million in year-one revenue and a $351,000 EBITDA target, but you can edit every driver from container counts to delivery fees. It is a practical tool for estimating profitability for portable storage businesses without the guesswork.
The unit reaches operational profitability in April 2026, just four months after the initial launch. By year five, annual EBITDA reaches $1,062,000 as you scale residential rentals and commercial contracts to a combined $1.17 million in annual revenue.
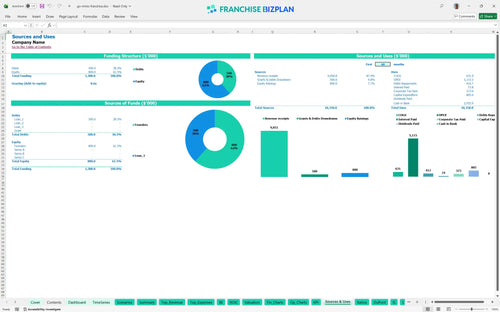
You need approximately $805,000 in upfront capital, which includes an $85,000 franchise fee and $300,000 for specialized hydraulic delivery trucks. The remaining funds cover $150,000 in container purchases and $150,000 for facility improvements at your Pflugerville-area hub.
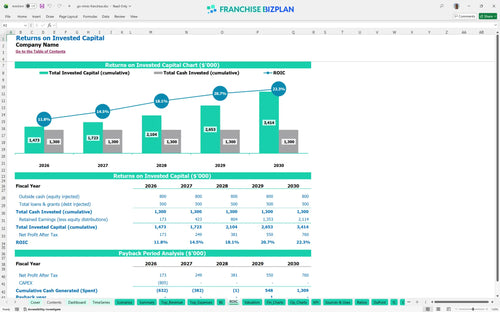
Calculating ROI for franchise investment shows a 4-year payback period and an Internal Rate of Return of 4.62%. While the initial equipment cost is high, the business model generates a 2.64 Return on Equity as revenue scales toward $2.45 million.
Monthly break-even is achieved in month four, driven primarily by the rapid deployment of the initial 20-foot container fleet. Your ability to hit this point depends on maintaining a lean dispatch coordinator and driver staff until residential rental volume stabilizes.
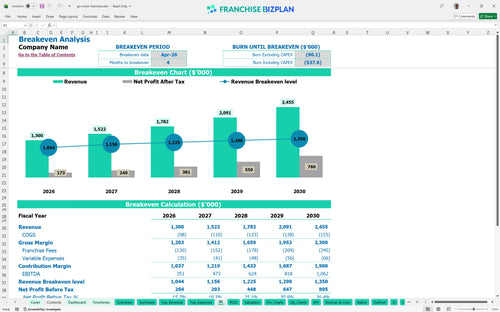
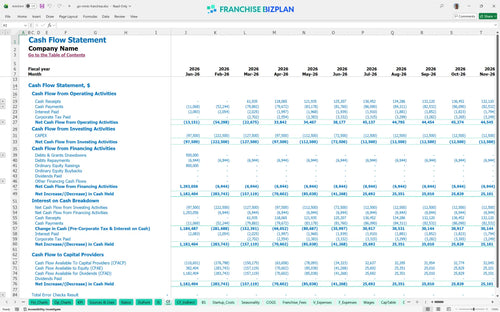
The lowest cash point occurs in June 2026 at $545,000, which represents your minimum liquidity needed to survive the ramp-up phase. You defintely need to track this closely, as the timing of truck deliveries and container purchases can swing your cash balance by six figures.
A high-growth scenario improves your year-one margin by accelerating commercial contract revenue beyond the $200,000 baseline. In a low-growth case, the $10,000 monthly hub rent becomes a heavier burden, potentially extending your payback period past the 4-year mark.
This franchise unit financial model excel template provides a fully customizable environment where you can adjust every variable of your portable storage business. You can modify container rental rates, delivery fees, and local labor costs to see how they impact your store-level margin in real-time. The pre-filled formulas handle the heavy lifting, so you focus on local market strategy rather than spreadsheet architecture.

Projecting revenue for local franchise units requires a multi-year view to account for container inventory growth and market density. This model delivers a comprehensive 5-year operating expense projection, showing your path from $1.3 million in year one to $2.45 million by year five. It maps out how EBITDA scales as your fleet matures and your fixed hub costs are spread over a larger customer base.

Understanding franchise royalty fees is critical because they represent a permanent 8% leak from your top-line revenue before any local bills are paid. This model integrates these obligations alongside the 2% marketing fund contribution to show the true net cash flow available to the owner. It ensures your financial planning for new franchise owners accounts for every dollar owed to the franchisor.

This franchise startup cost calculator breaks down the heavy initial lift, including $300,000 for hydraulic trucks and $150,000 for container inventory. By identifying the exact sales volume needed to cover your $10,000 monthly hub rent and $24,250 in monthly base salaries, you can pinpoint your break-even date. Knowing how to calculate startup costs for a storage franchise is the first step toward protecting your personal liquidity.

Analyzing franchise operational costs is easier when you have built-in industry benchmarks to sanity-check your transportation fuel and maintenance spending. This model uses researched data to ensure your 4.5% container maintenance assumption aligns with reality. It helps you identify if your labor model is bloated or if your occupancy costs are out of sync with high-performing units.


Simply purchase and download the financial model template, then access it instantly using Microsoft Excel or Google Sheets. No installation or technical expertise required-just open and start working.

Enter your business-specific numbers, including revenue projections, costs, and investment details. The pre-built formulas will automatically calculate financial insights, saving you time and effort.

Leverage the investor-ready format to confidently showcase your financial projections to banks, franchise representatives, or investors. Impress stakeholders with clear, data-driven insights and professional reports.

Leverage the investor-ready format to confidently present your projections to banks, franchise representatives, or investors.