


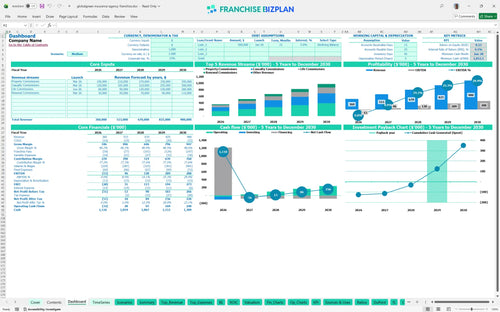
All-in-one Dashboard
Core inputs and core outputs



This insurance agency franchise model provides a ready-to-use Excel framework for forecasting commissions, payroll, and cash flow for a new insurance agency location.
Core inputs and core outputs
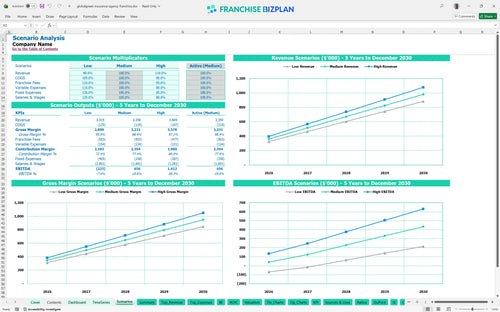
Three scenario analysis
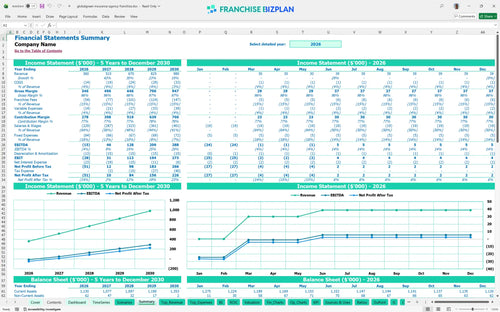
Presentation ready
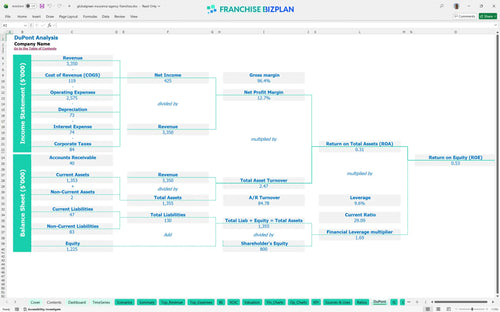
DuPont analysis
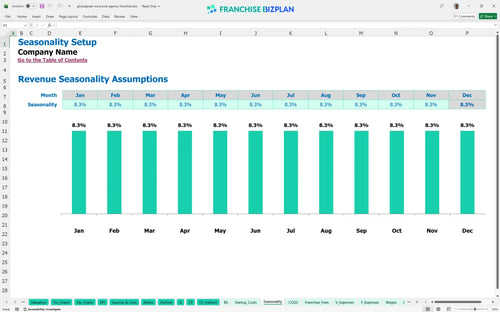
Researched revenue assumptions
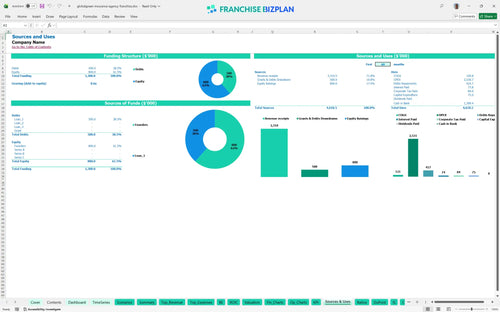
Lender-friendly financial outputs
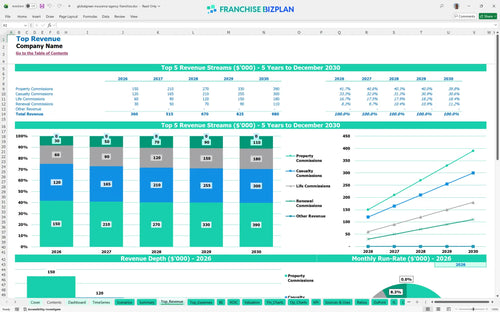
Revenue stream detailed view
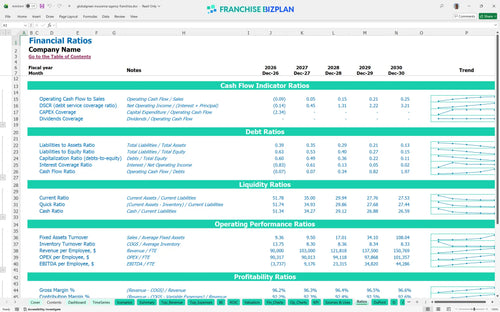
Performance metrics benchmark
This insurance agency franchise model is built on a multi-carrier insurance platform, incorporating researched data on commission revenue models and operational costs. Key metrics like the 15% royalty fee and $65,000 principal salary are pre-loaded into the financial model template for insurance agency franchise planning, but you can edit every cell to fit your specific market. With a projected Year 3 EBITDA of $128,000, the model shows a clear path from initial startup to a mature, cash-flowing agency.
The insurance agency franchise profitability analysis shows a transition to positive EBITDA in Year 2, reaching $46,000 after an initial Year 1 startup loss of $15,000. By Year 5, the unit is projected to generate $288,000 in annual earnings as the renewal book matures. Every dollar of renewal commission is pure margin once the initial acquisition cost is cleared.
To calculate startup costs for insurance franchise units, you must account for the $10,999 franchise fee and roughly $65,000 in equipment and build-out. Total initial capital is allocated across leasehold improvements, computer workstations, and essential office furniture to ensure a professional setup. You can't sell policies if your workstations aren't up to carrier security specs.
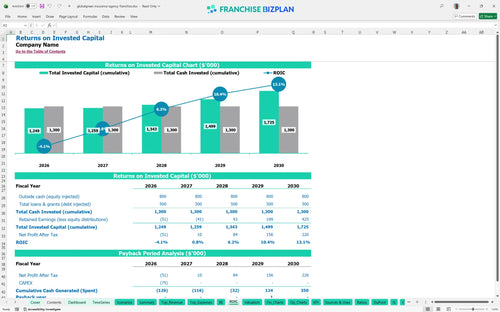
Evaluating insurance franchise investment potential requires looking at the 4-year payback period and the 4.07% internal rate of return. While the ROI is steady, the real value lies in the 0.53 return on equity and the growing recurring commission revenue model. Insurance is a marathon of renewals, not a sprint of new sales.
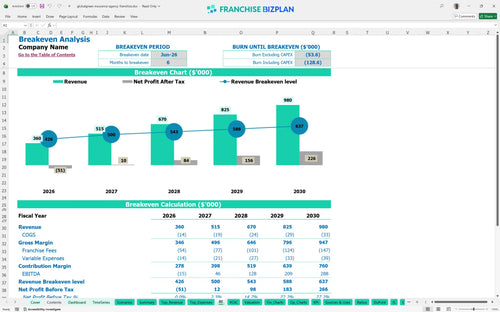
The pro forma financial statements for franchise units indicate a break-even date in June 2026, exactly 6 months after opening. This timeline depends heavily on the $3,500 monthly rent and the ability of your producers to hit early sales targets in property and casualty lines. Six months to break-even is fast, but only if your producers hit the ground running.
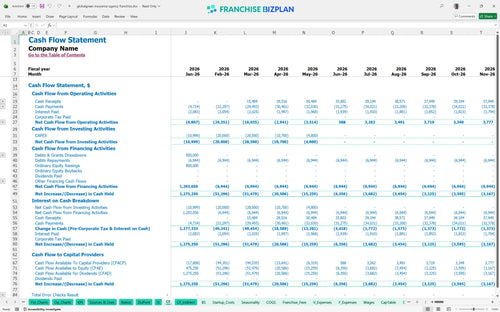
Financial forecasting for new insurance agency locations shows the lowest cash point occurring in January 2028, with a required minimum cash balance of $1,053,000. You defintely need a robust capital buffer to manage the timing gap between paying producers and receiving carrier commission checks. Cash is king, especially when you're waiting on carrier cycles.
Estimating insurance agency recurring revenue across low, medium, and high cases reveals how sensitive the 4-year payback is to sales volume. A high-performance scenario significantly improves the Year 1 margin, while the medium case relies on steady growth from $360,000 to $980,000 over five years. A high-performing producer changes the math for the entire office.
This insurance agency franchise model is built in Excel with open formulas, allowing you to swap out property and casualty commission rates or adjust local rent. You can test different production levels for your licensed producers to see how staffing changes your bottom line. Every cell is editable, so you can adapt the franchise business plan Excel to your specific territory and market conditions.

Plan your agency's trajectory from a $360,000 first-year revenue base to nearly $1 million by year five. The insurance agency financial projections track renewal commissions, which are the lifeblood of profitability, alongside new business across property, casualty, and life lines. This long-term view helps you see the compounding effect of a growing book of business.

With a 15% royalty fee on gross commissions, understanding your net margin is critical. This franchise royalty fee structure is baked into the model so you know exactly what remains for payroll and rent after the franchisor takes their cut. The template also accounts for the initial $10,999 fee, ensuring your cash flow reflects real-world franchise obligations.

Total hard costs for this unit sit around $75,000, covering everything from the initial fee to office furniture and signage. You need to know how to calculate startup costs for insurance franchise units accurately to avoid mid-launch cash crunches. This model targets a 6-month breakeven point, showing you the exact commission volume needed to cover your fixed monthly overhead.

Use built-in benchmarks to see if your $3,500 monthly rent or producer salaries align with an operating expenses for retail insurance storefront profile. Comparing your projected 15% royalty burden against industry averages helps you validate the investment potential. These benchmarks act as a sanity check for your commission revenue model and staffing ratios.


Simply purchase and download the financial model template, then access it instantly using Microsoft Excel or Google Sheets. No installation or technical expertise required-just open and start working.

Enter your business-specific numbers, including revenue projections, costs, and investment details. The pre-built formulas will automatically calculate financial insights, saving you time and effort.

Leverage the investor-ready format to confidently showcase your financial projections to banks, franchise representatives, or investors. Impress stakeholders with clear, data-driven insights and professional reports.

Leverage the investor-ready format to confidently present your projections to banks, franchise representatives, or investors.