
All-in-one Dashboard
Core inputs and core outputs


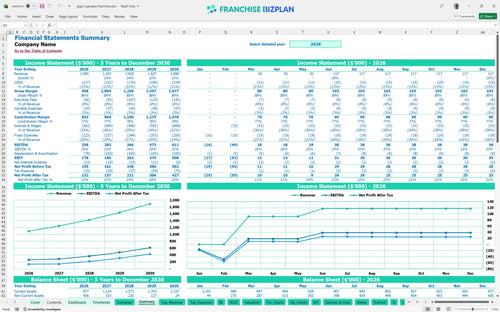
This franchise financial model includes a comprehensive suite of interconnected tabs for revenue forecasting, expense tracking, capital expenditure planning, and five-year financial statements.
Core inputs and core outputs
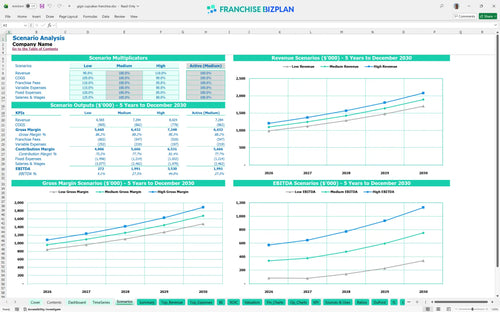
Three scenario analysis
Presentation ready
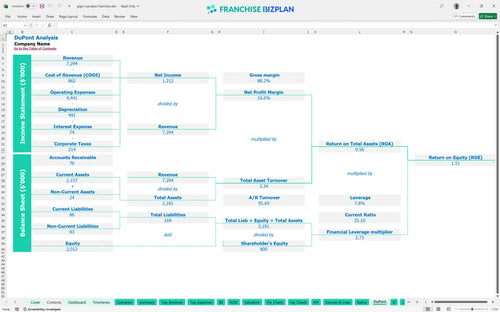
DuPont analysis
Researched revenue assumptions
Lender-friendly financial outputs
Revenue stream detailed view
Performance metrics benchmark
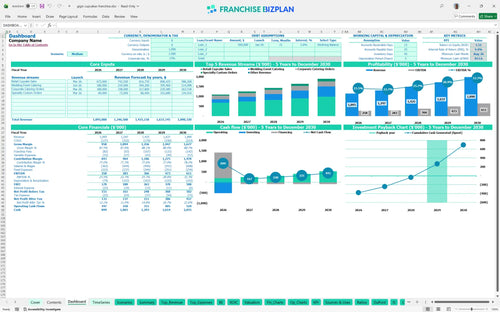
We built this franchise unit profitability analysis using detailed research into the gourmet dessert sector. Key assumptions, including the $1,095,000 year-one revenue and $258,000 EBITDA, are pre-populated with data specific to this bakery model and remain fully editable. This ensures you start with a credible baseline for your investment decision.
The model shows this unit defintely hits profitability quickly, reaching its break-even date in April 2026, just four months after launch. By year one, you are looking at an EBITDA of $258,000, which grows to $611,000 by year five as your catering and retail streams scale. This trajectory assumes you maintain tight control over your ingredient costs and labor efficiency. How to evaluate the profitability of a food franchise depends on this early ramp-up speed.
The cost breakdown for opening a high-end bakery unit totals approximately $515,000 in initial capital expenditures. This includes the $35,000 franchise fee, $220,000 for leasehold improvements, and $90,000 for ovens and mixers. You also need to account for the $814,000 minimum cash balance projected for August 2026 to ensure you have enough runway during the initial growth phase.
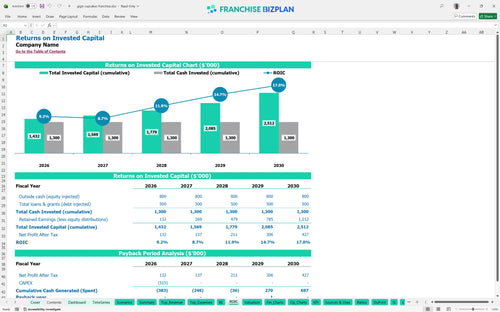
Your ROI calculation for franchises shows a 4.4% internal rate of return (IRR) and a return on equity (ROE) of 1.51. The model projects a 4-year payback period, meaning you recover your initial investment by the end of the fourth year of operations. While the IRR is conservative, the steady climb in EBITDA provides a strong foundation for multi-unit operators looking for stable cash flow.
Estimating operating costs for a bakery franchise shows you need to hit break-even within 4 months to stay on track. The primary driver for this is your $14,000 monthly rent and the 7.5% combined royalty and marketing fee. Reaching this point depends on hitting your retail sales targets of $450,000 in the first year while managing the 10.5% ingredient cost margin.
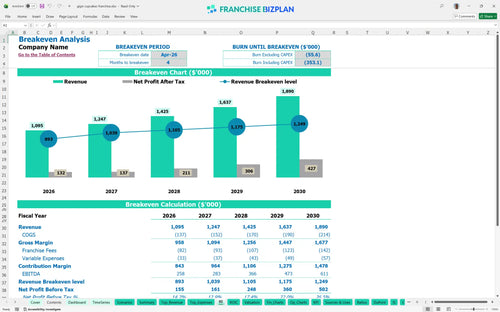
Using this franchise investment analysis Excel tool, the lowest cash point is identified as $814,000 in August 2026. This suggests you need a significant capital cushion to handle the timing gaps between your $515,000 build-out and the ramp-up of catering revenue. Maintaining a cash buffer is critical to surviving the first 12 months of operation.
A profit margin analysis for retail food franchises reveals that a 10% drop in revenue can delay your payback period by over a year. Conversely, hitting the high-case scenario through aggressive local marketing and wedding partnerships can push year-five EBITDA well beyond the $611,000 base projection. The model allows you to toggle these variables to see the immediate impact on your cash runway and ROE.
Finance: update unit break-even and payback model by Friday.
This Excel template for bakery franchise financial planning provides a flexible environment where every formula is open and every assumption is editable. You can easily adjust the retail cupcake sales forecasts or catering growth rates to match your specific territory and local competition. The model handles the heavy lifting of financial logic so you can focus on testing different business scenarios without breaking the math.

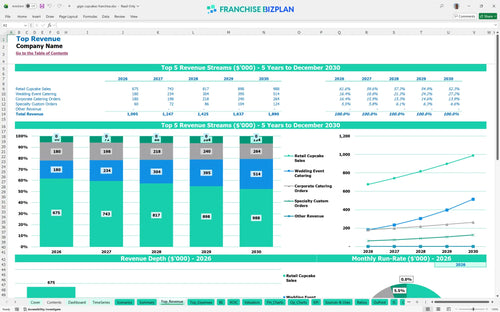
Planning for a long-term exit or multi-unit expansion requires more than a one-year snapshot. This franchise unit revenue forecasting spreadsheet maps out your growth from a year-one revenue of $1,095,000 to a projected $1,890,000 by year five. It tracks how scaling your wedding event catering and corporate orders impacts your bottom line as the unit matures over time.

Operating a brand-name unit comes with specific franchise operating expenses that can squeeze margins if not tracked properly. This model automatically calculates the 5% royalty fee and 2.5% marketing fund contribution based on your gross sales. By baking these costs into your monthly P&L (profit and loss statement), you get a realistic view of your actual take-home cash after the franchisor takes their cut.

Knowing how to calculate startup costs for a food franchise is the first step to avoiding a cash crunch. This tool aggregates your $35,000 franchise fee, $220,000 leasehold improvements, and $90,000 in baking equipment to show your total entry cost. It then identifies the exact sales volume needed to cover your $14,000 monthly rent and other fixed overheads.

This bakery business feasibility study uses researched data to set realistic expectations for labor and ingredient costs. With ingredient costs starting at 10.5% and labor structured around a $65,000 store manager and skilled decorators, you can see how your unit compares to high-performing peers. These benchmarks act as a sanity check for your pro-forma (projected) financial statements.


Simply purchase and download the financial model template, then access it instantly using Microsoft Excel or Google Sheets. No installation or technical expertise required-just open and start working.

Enter your business-specific numbers, including revenue projections, costs, and investment details. The pre-built formulas will automatically calculate financial insights, saving you time and effort.

Leverage the investor-ready format to confidently showcase your financial projections to banks, franchise representatives, or investors. Impress stakeholders with clear, data-driven insights and professional reports.

Leverage the investor-ready format to confidently present your projections to banks, franchise representatives, or investors.