
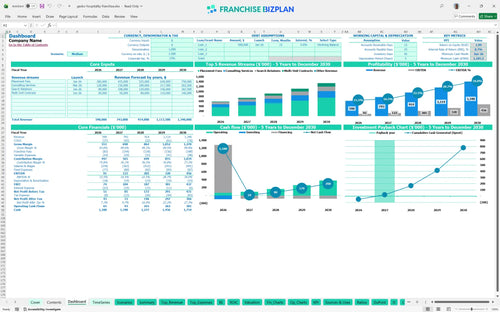
All-in-one Dashboard
Core inputs and core outputs


This franchise profitability analysis tool includes a complete franchise unit investment breakdown, multi-year income statements, and automated cash flow tracking designed for professional recruitment operators.
Core inputs and core outputs
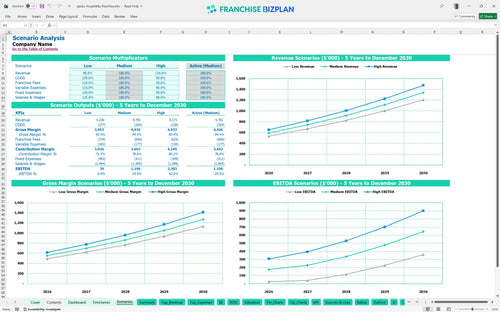
Three scenario analysis
Presentation ready
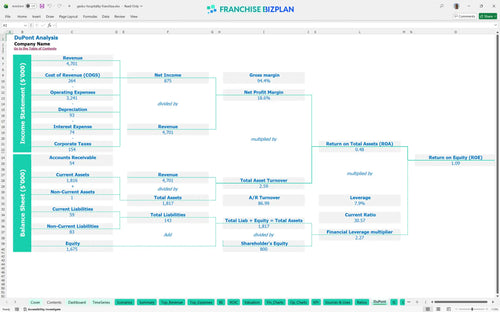
DuPont analysis
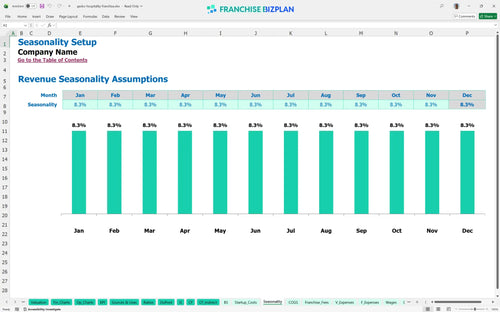
Researched revenue assumptions
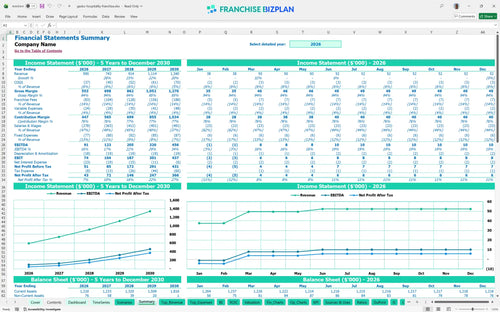
Lender-friendly financial outputs
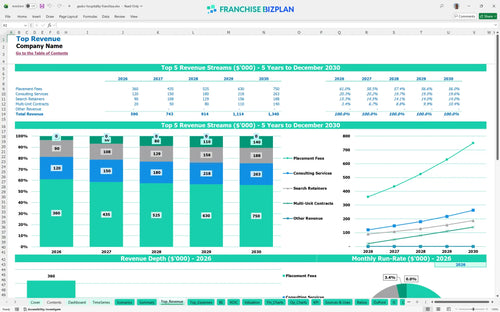
Revenue stream detailed view
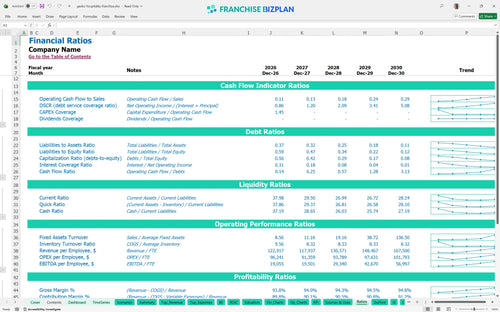
Performance metrics benchmark
We developed this financial model through deep research into hospitality recruitment revenue models and operational standards. The pre-populated data reflects real-world costs like the $50,000 franchise fee and a 10% royalty rate, allowing you to focus on executing your local marketing and talent acquisition strategy.
The unit reaches profitability in its first month, January 2026, with a projected year-one EBITDA of $91,000. Earnings grow steadily as you scale, reaching $456,000 by year five as multi-unit contracts and search retainers become a larger part of the mix.
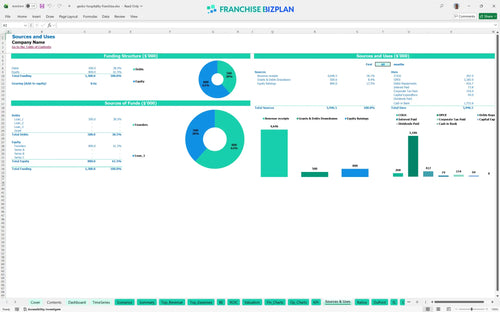
You need $94,000 in initial capital to cover the franchise unit investment breakdown, plus a significant cash buffer for operations. The primary uses of funds include the initial brand fee, office improvements, and setting up your IT infrastructure for candidate tracking.
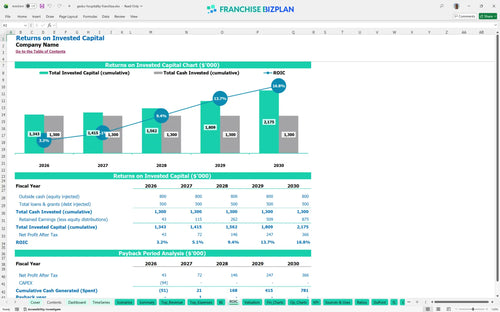
Investors can expect an internal rate of return (IRR) of 8.67% and a return on equity (ROE) of 1.09. The payback period is efficient, with the total initial investment recovered within two years of operation.
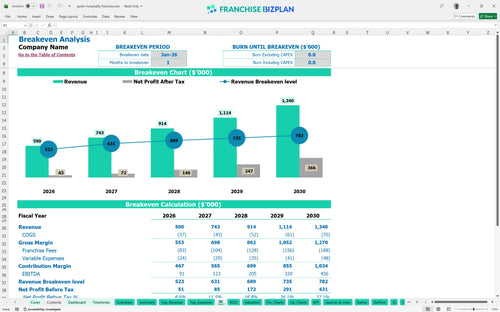
The unit breaks even in January 2026, needing roughly $49,000 in monthly revenue to cover fixed costs and royalties. The biggest driver for reaching this point quickly is the volume of placement fees, which start at a projected $240,000 in the first year.
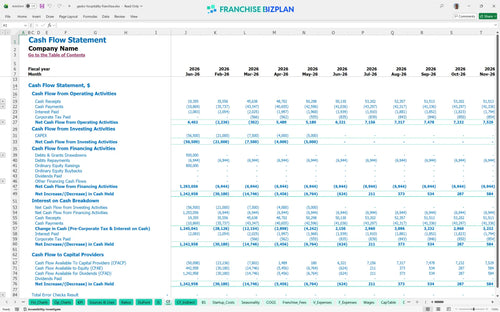
The lowest cash point occurs in June 2026, with a minimum cash balance of $1.185 million, providing a massive safety net. This high liquidity level defintely ensures the business can handle the timing gaps between candidate placement and client payment collection.
The high scenario assumes faster adoption of multi-unit contracts, which can double your year-one margin. Conversely, the low scenario accounts for slower candidate sourcing, which may delay your peak cash point but still maintains a strong runway due to the low fixed overhead.
This hospitality staffing franchise financial model is built in Excel with fully editable assumptions and pre-filled formulas. You can easily adjust placement fee volumes, recruiter commission structures, and local office overhead to match your specific territory and market conditions.

Plan your long-term growth with a detailed franchise unit financial projection template that tracks performance from launch through year five. The model provides a clear view of how scaling from $590,000 in year-one revenue to $1.34 million in year five impacts your bottom line and cash position.

This tool simplifies the franchise royalty fee calculation by automating the 10% royalty and 4% marketing fund contributions. It ensures you understand the impact of these off-the-top costs on your staffing agency profit margins before you commit to a territory.

Accurately estimate your recruitment agency franchise startup costs, including the $50,000 initial fee and $12,000 in office improvements. The model identifies the exact revenue volume needed to cover your $6,450 in monthly fixed costs and variable recruiter expenses.

Use this hospitality business plan excel template to sanity-check your recruitment revenue models against industry standards. It includes benchmarks for candidate sourcing costs and recruiter salaries, helping you maintain a competitive store-level margin while scaling your team.


Simply purchase and download the financial model template, then access it instantly using Microsoft Excel or Google Sheets. No installation or technical expertise required-just open and start working.

Enter your business-specific numbers, including revenue projections, costs, and investment details. The pre-built formulas will automatically calculate financial insights, saving you time and effort.

Leverage the investor-ready format to confidently showcase your financial projections to banks, franchise representatives, or investors. Impress stakeholders with clear, data-driven insights and professional reports.

Leverage the investor-ready format to confidently present your projections to banks, franchise representatives, or investors.