
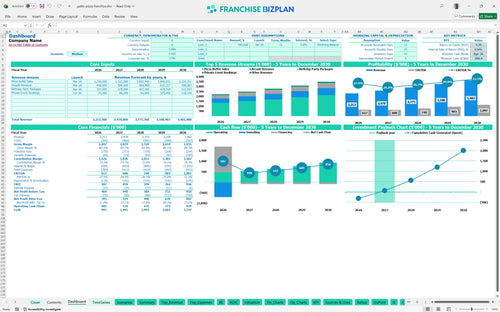
All-in-one Dashboard
Core inputs and core outputs


This tool contains a complete set of interconnected financial statements and assumption tabs designed specifically for a high-volume pizza and entertainment center operation.
Core inputs and core outputs
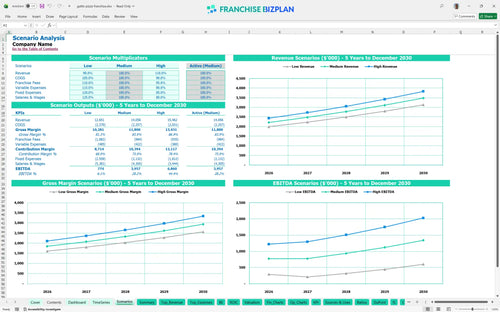
Three scenario analysis
Presentation ready
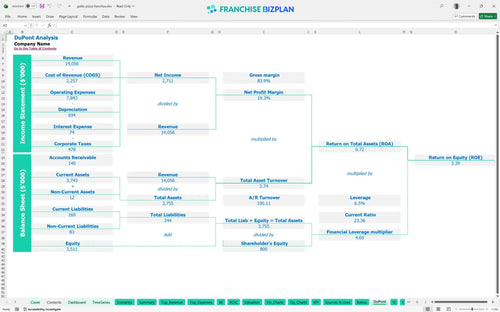
DuPont analysis
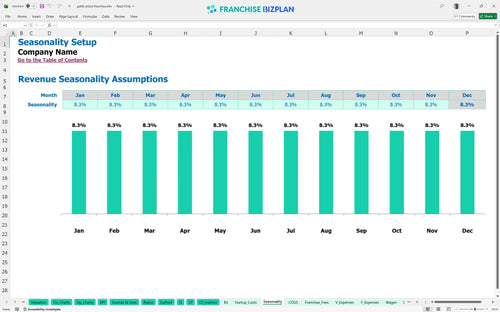
Researched revenue assumptions
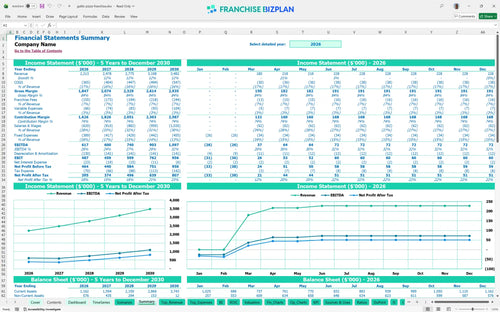
Lender-friendly financial outputs
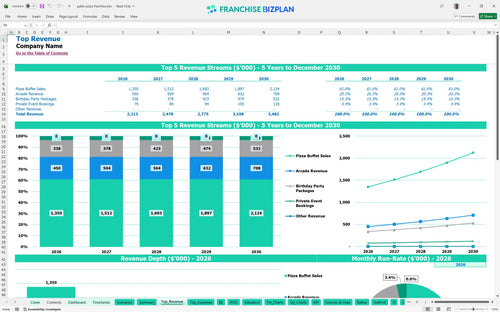
Revenue stream detailed view
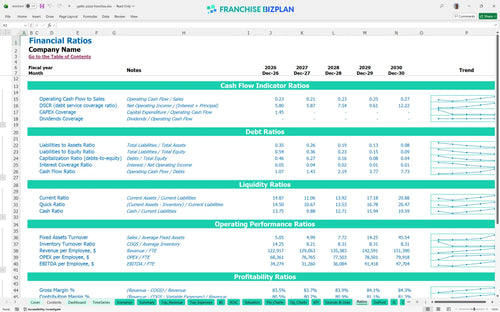
Performance metrics benchmark
We built this financial model for family entertainment center franchise operations using intensive market research and real-world data. The assumptions for revenue streams like the $900,000 pizza buffet and $300,000 arcade sales are pre-populated and fully editable to fit your specific site. With an initial Year 1 EBITDA of $617,000, this model gives you a credible starting point for your investment committee or bank loan application.
The unit is projected to reach profitability in its first year, with Year 1 EBITDA starting at $617,000. By Year 5, as you optimize food costs down to 13.2%, annual EBITDA is expected to climb to $1,097,000. This Excel template for restaurant franchise profitability shows that while the build-out is heavy, the high-volume buffet model scales quickly.
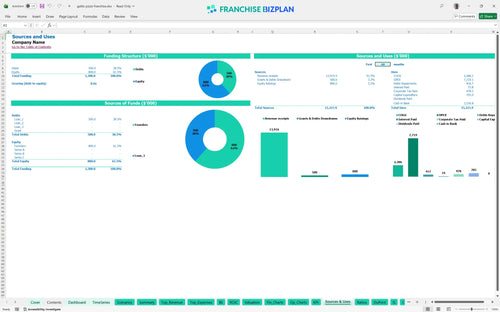
You will need approximately $705,000 in upfront CAPEX to launch this unit, plus a working capital buffer. The biggest chunk goes toward leasehold improvements and the arcade zone, which are the primary drivers of foot traffic. Knowing how to calculate pizza franchise startup costs accurately is the difference between a smooth opening and a cash crunch.
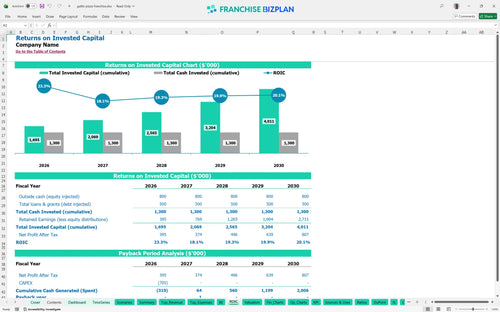
Investors can expect an Internal Rate of Return (IRR) of 6.57% and a Return on Equity (ROE) of 3.39. The payback period is defintely attractive at just 2 years, meaning you recover your initial capital relatively fast for a 10,000-square-foot facility. Calculating ROI for arcade and pizza franchise units requires looking at both the food and the gaming margins together.
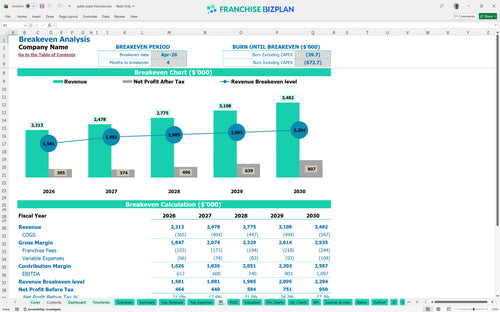
The unit hits its monthly break-even point in April 2026, just 4 months after opening. Your biggest fixed hurdle is the $22,000 monthly rent, so hitting your volume targets for the pizza buffet is critical. This pizza restaurant business model spreadsheet helps you track how many 'taps' at the buffet you need to cover the lights and the lease.
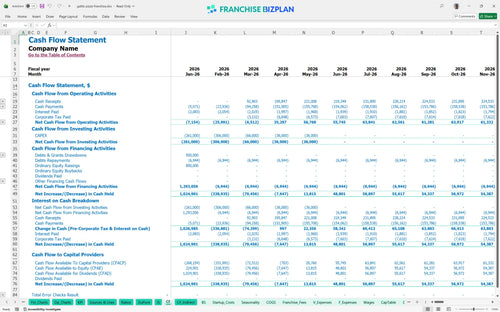
The lowest cash point occurs in April 2026, with a minimum cash balance of $599,000. This financial planning guide for restaurant franchise owners suggests keeping a healthy buffer to handle the ramp-up of the $45,000 event coordinator and kitchen staff. If your arcade revenue lags, the cash runway gets shorter, so watch your weekly arcade 'drop' closely.
The model compares scenarios where Year 1 revenue of $2,213,000 grows to $3,482,000 by Year 5. In a high-growth scenario, your event-based revenue from birthday parties ($225k in Year 1) can significantly boost your net margin. These franchise unit financial projections for investors show that even a small dip in buffet traffic can be offset by strong arcade performance.
Finance: update unit break-even and payback model by Friday.
This franchise financial model template is built in Excel to give you total control over your numbers. You can swap out pre-filled formulas and edit assumptions to match your specific territory, whether you are looking at a high-traffic suburban corner or a dense urban center. It is designed to be a flexible pizza restaurant business plan Excel tool that adapts as your local market conditions change.

Planning for the long haul is the only way to survive in the pizza buffet space. This franchise investment projection model provides a detailed 5-year look at your revenue, costs, and cash flow forecasting to ensure the unit stays healthy. We map out the growth from initial opening through mature-unit performance so you can see the big picture before signing a lease.

The model tracks every dollar owed to the franchisor, including the initial $25,000 franchise fee and ongoing obligations. Using this franchise startup cost calculator, you can see how the 5% royalty and 2% marketing fund impact your bottom line each month. It is essential to understand these 'off-the-top' costs before you calculate your take-home pay.

Getting the doors open is the biggest hurdle, and this restaurant profitability analysis template breaks down every dollar of the build-out. We help you estimate the total startup investment and the exact sales volume needed to cover your operational expenses. This startup cost breakdown for pizza restaurant franchise units ensures you aren't surprised by hidden pre-opening costs.

We include unit economics benchmarks to help you sanity-check your labor and occupancy costs against industry standards. If your food costs are drifting above the 14% target, the model flags it so you can adjust your buffet management. This helps you maintain a competitive edge while keeping your store-level margins in a healthy range.


Simply purchase and download the financial model template, then access it instantly using Microsoft Excel or Google Sheets. No installation or technical expertise required-just open and start working.

Enter your business-specific numbers, including revenue projections, costs, and investment details. The pre-built formulas will automatically calculate financial insights, saving you time and effort.

Leverage the investor-ready format to confidently showcase your financial projections to banks, franchise representatives, or investors. Impress stakeholders with clear, data-driven insights and professional reports.

Leverage the investor-ready format to confidently present your projections to banks, franchise representatives, or investors.