
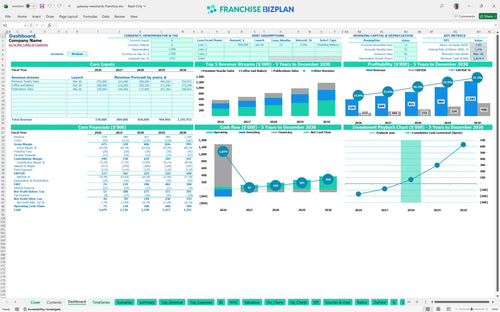
All-in-one Dashboard
Core inputs and core outputs


This franchise unit financial model template provides a dynamic Excel environment to forecast every dollar from your first day of trading through five years of operations.
Core inputs and core outputs
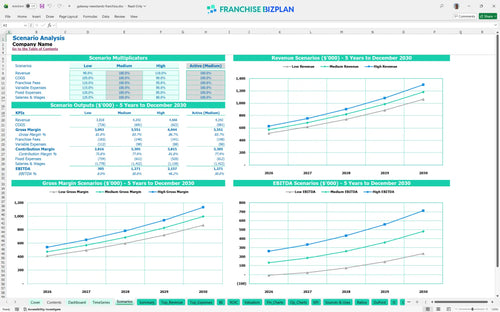
Three scenario analysis
Presentation ready
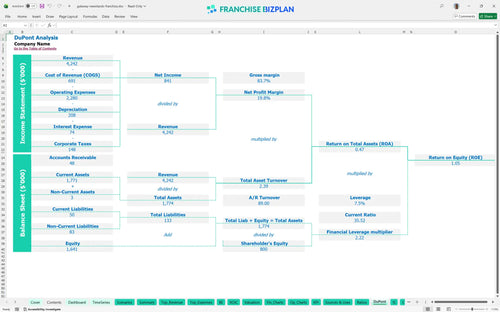
DuPont analysis
Researched revenue assumptions
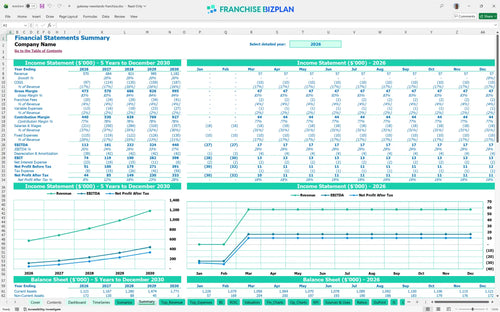
Lender-friendly financial outputs
Revenue stream detailed view
Performance metrics benchmark
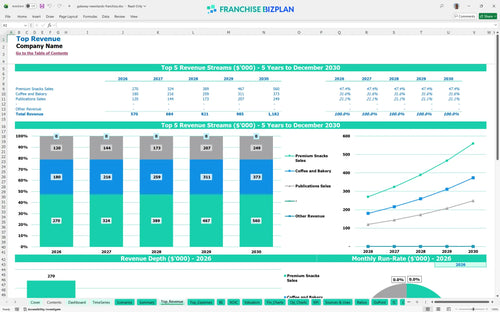
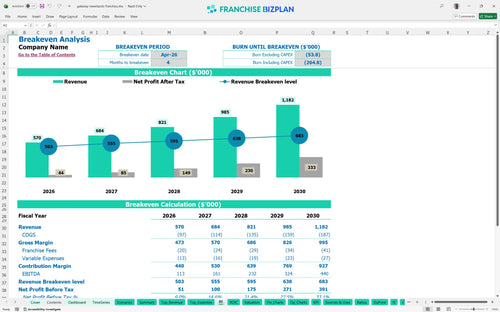
We built this financial model for a premium retail unit using detailed research on urban convenience hubs. The pre-populated assumptions for revenue streams, like the $180,000 in snack sales, and expenses like the 3.5% royalty fee are fully editable to match your specific territory. With a projected Year 1 EBITDA of $113,000 and a 4-month window to break-even, this model provides a realistic look at the unit economics of a high-traffic transit location.
You can expect this unit to reach profitability by April 2026, just four months after launching operations. This quick turnaround is driven by high-margin coffee and bakery sales and a lean 3.5% royalty structure that preserves store-level cash flow.
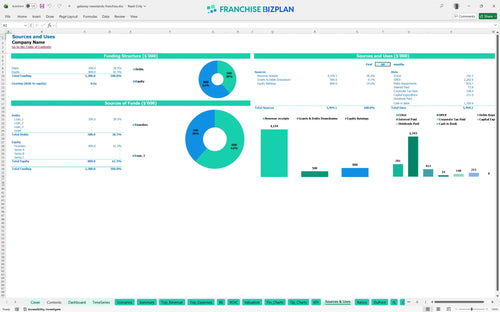
To launch this unit in the US, you will need approximately $211,000 for the initial build-out and equipment, plus a significant cash buffer. The largest portion of your investment goes toward leasehold improvements and automated checkout technology to handle peak commuter volume.
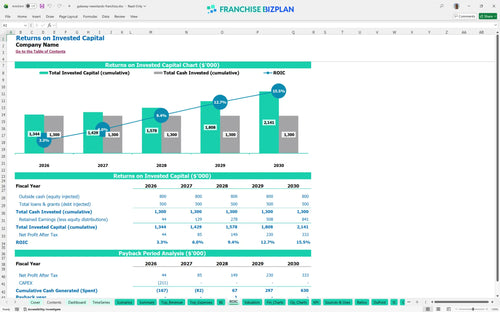
The model projects an internal rate of return (IRR) of 5.05% with a full payback period of 3 years. While the initial return on equity is 1.05, the annual EBITDA grows significantly to $440,000 by the fifth year as the location matures.
The unit hits its break-even point in April 2026 once monthly sales cover the $6,500 rent and $10,000+ in total wages. Achieving this depends heavily on capturing daily repeat traffic from the surrounding office towers and transit nexus.
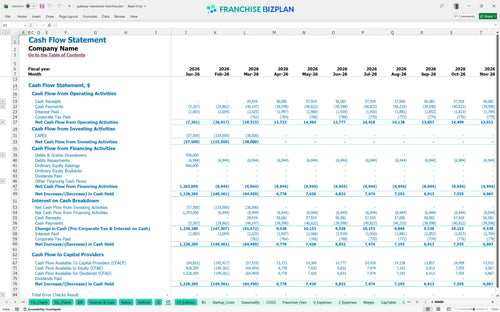
The lowest cash point occurs in March 2026 during the initial ramp-up phase, requiring a minimum cash position of $1,014,000 to remain secure. This high buffer ensures you can handle the $211,000 in upfront CAPEX and any early-stage operating losses before the unit stabilizes.
In a high-performance scenario, reaching the $1.18 million revenue mark earlier can significantly boost your Year-1 EBITDA above the base $113,000. Conversely, a low-revenue scenario would delay the 3-year payback and require a larger cash reserve to cover the $6,500 monthly fixed rent.
This franchise financial model template is built in Excel with fully editable formulas, so you can swap out our researched assumptions for your specific local data. You can adjust the $6,500 monthly rent or the 14.5% inventory costs to see how they impact your bottom line instantly. It is a flexible tool designed to handle different urban footprints or transit hub locations without breaking the math. Honestly, the best part is that every revenue driver and expense category is unlocked for your own planning needs.

Success in a retail franchise business plan requires looking past the first year to see how the unit scales as foot traffic matures. This model provides a detailed five-year roadmap, showing revenue growing from $570,000 in year one to over $1.18 million by year five. It tracks the full transition from early-stage operations to a mature unit generating $440,000 in annual EBITDA. We included the balance sheet and cash flow views so you can monitor your long-term equity growth and total liquidity over time.

Operating within a brand system involves specific financial obligations that this franchise royalty fee calculator handles with precision. The model bakes in the 3.5% royalty fee and the initial $15,000 brand entry cost to ensure your store-level margin is realistic. Plus, it leaves room for marketing fund contributions even if they are currently set to zero in our research. Tracking these ongoing costs is vital because even a small royalty burden changes your daily break-even target in a high-volume convenience environment.

Estimating franchise unit startup costs is the first hurdle for any new operator, and this model breaks down the $211,000 total investment into clear categories. You can see how the $85,000 leasehold improvements and $45,000 for self-checkout kiosks impact your initial capital needs. The tool identifies exactly when your monthly revenue covers both fixed and variable costs, which is projected for April 2026. Knowing this date helps you manage your working capital and set clear performance targets for your store manager from day one.

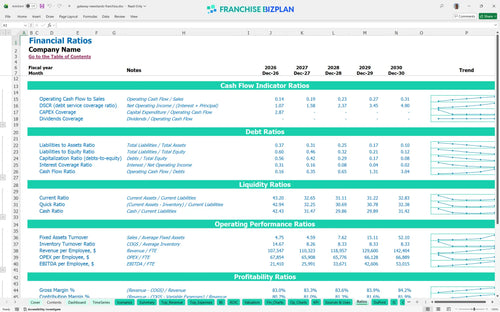
We incorporated retail operating expenses and labor benchmarks to help you sanity-check your projections against industry standards. For instance, the model uses a $52,000 manager salary and a 14.5% starting inventory cost to keep your expectations grounded in reality. These benchmarks help you defintely identify if your local utilities or insurance costs are drifting too far from the typical range for a premium urban retail unit. It is a practical way to ensure your financial plan is both ambitious and achievable in a competitive market.


Simply purchase and download the financial model template, then access it instantly using Microsoft Excel or Google Sheets. No installation or technical expertise required-just open and start working.

Enter your business-specific numbers, including revenue projections, costs, and investment details. The pre-built formulas will automatically calculate financial insights, saving you time and effort.

Leverage the investor-ready format to confidently showcase your financial projections to banks, franchise representatives, or investors. Impress stakeholders with clear, data-driven insights and professional reports.

Leverage the investor-ready format to confidently present your projections to banks, franchise representatives, or investors.