
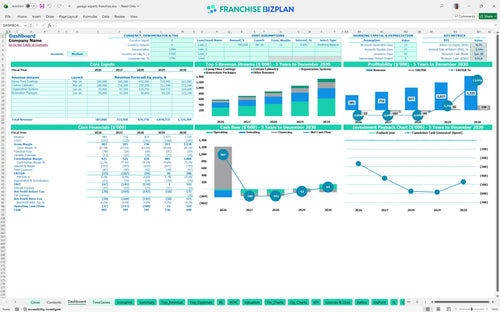
All-in-one Dashboard
Core inputs and core outputs


This Excel template for franchise unit business plan includes dynamic calculators for revenue, labor, and CAPEX to help you master your unit economics.
Core inputs and core outputs
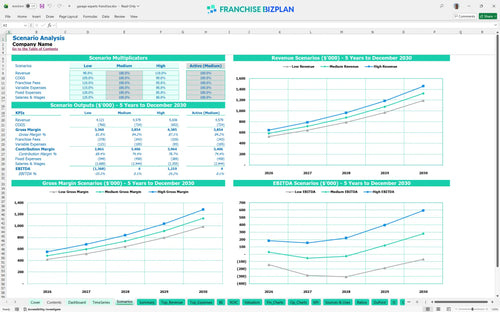
Three scenario analysis
Presentation ready
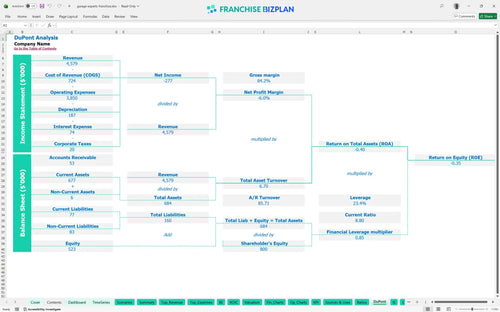
DuPont analysis
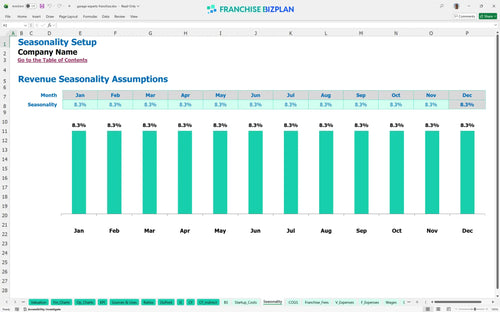
Researched revenue assumptions
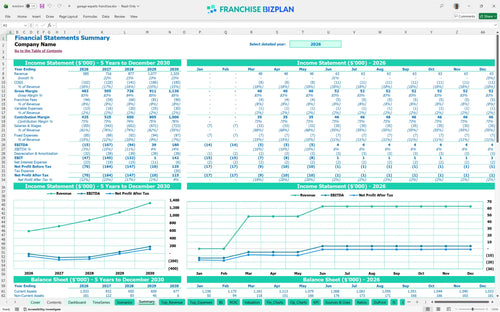
Lender-friendly financial outputs
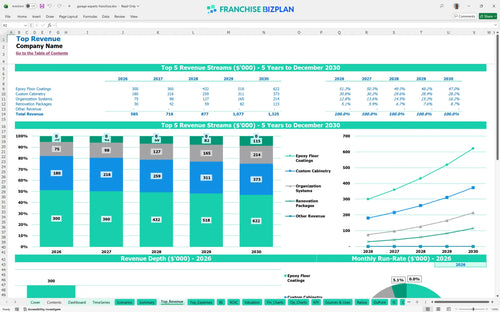
Revenue stream detailed view
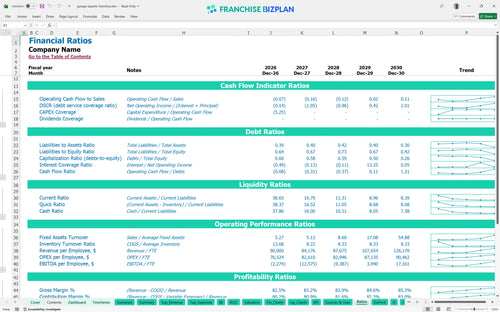
Performance metrics benchmark
We built this financial model for garage renovation franchise units using detailed market research on high-end service territories. The pre-populated data covers everything from the $35,000 vehicle investment to the 1.5% subcontractor fees, ensuring you start with a realistic baseline. With Year 5 EBITDA projected at $180,000, the model shows the path from a negative start to a mature, cash-flowing asset.
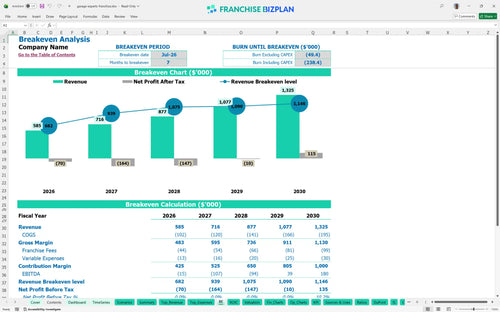
Based on the data, the unit hits monthly break-even by July 2026, just seven months after launch. However, full-year EBITDA does not turn positive until Year 4, reaching $39,000 after accounting for the heavy annual installer payroll and ramp-up costs. Still, the Year 5 jump to $180,000 shows the power of scale.
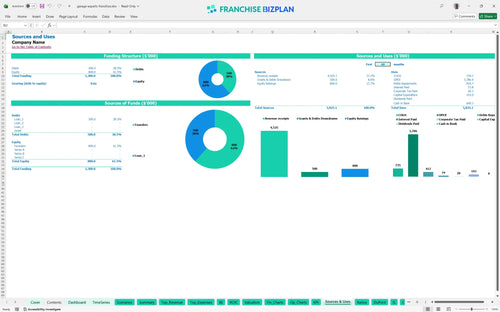
You need roughly $193,000 in upfront capital to cover the initial franchise fee, showroom build-out, and equipment. This investment analysis for residential service franchise units also accounts for a $536,000 minimum cash requirement to sustain operations through the early years of negative EBITDA. Here is the quick math: your cash buffer is your lifeline.
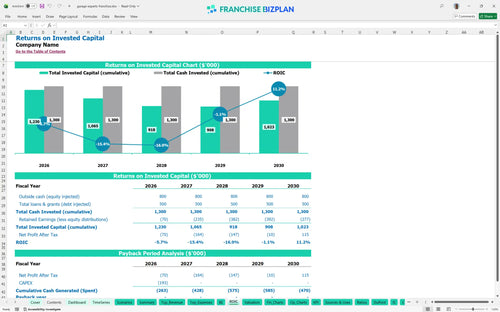
The model shows an IRR of -2.53% over the first five years, with payback occurring after the five-year mark. While Year 5 shows a healthy $180,000 EBITDA, the early ramp-up costs and high staffing levels mean you are playing a long-game for equity value. What this estimate hides is the potential resale value of a $1.3M revenue business.
To cover fixed costs like the $4,500 rent and $9,200 in monthly insurance and utilities, you need to hit your revenue targets by month seven. The biggest driver here is your sales consultant's ability to move Epoxy Floor Coatings, which represent the bulk of your Year 1 volume. Plus, keeping material costs at 14.5% is non-negotiable.
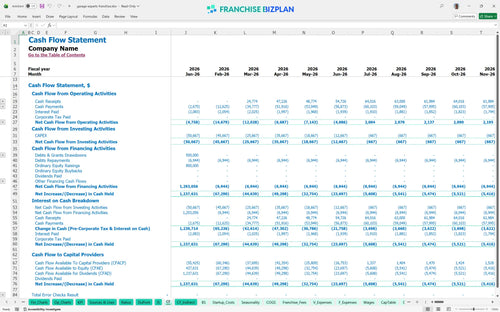
Your lowest cash point occurs in January 2030, suggesting that the business requires significant working capital to bridge the gap between Year 2 losses and Year 4 gains. Estimating profitability for home improvement franchise units requires a deep buffer; we recommend at least 12 months of operating expenses in reserve. Cash flow forecast template for franchise owners helps track this monthly.
A High scenario-hitting $414,000 in epoxy sales sooner-can pull the payback period into Year 4. Conversely, a Low scenario where labor stays high while revenue lags will deepen the $107,000 Year 2 loss, making the financial feasibility study for garage flooring business success much tighter. Execution on the ground changes everything.
This franchise unit financial model template is built in Excel, meaning you aren't locked into a black box. You can tweak every assumption from the $4,500 monthly showroom rent to specific installer headcount as your territory grows. It is a living business plan for franchise unit operations that lets you test different what-if scenarios before signing a lease.

We mapped out a 5-year trajectory where revenue climbs from $585,000 in Year 1 to over $1.3 million by Year 5. This home service franchise financial projection tracks how your margins evolve as you scale from one lead installer to a team of five. It provides a clear view of the long-term profitability analysis needed to justify the initial sweat equity.

The model bakes in the 6% royalty and 1.5% marketing fund contributions right off the top. By automating the franchise royalty structure, you see exactly how much cash stays in the business after the franchisor takes their cut. It is vital to track these because at $1.3M in sales, those fees total nearly $100,000 annually. Honestly, small fees add up fast.

Use this franchise startup cost calculator to map out the $193,000 in initial CAPEX, including the $50,000 franchise fee and $45,000 showroom build-out. The model identifies your break-even sales estimates, showing you exactly when monthly revenue covers your $4,500 rent and $75,000 GM salary. Knowing your floor is the only way to sleep at night during the ramp-up.

We included benchmarks for coatings and materials, which start at 14.5% of sales and should drop to 12.5% as you gain scale. This franchise profitability analysis tool helps you compare your labor costs against industry norms for residential service franchises. If your installer wages exceed these targets, your store-level EBITDA will defintely suffer.


Simply purchase and download the financial model template, then access it instantly using Microsoft Excel or Google Sheets. No installation or technical expertise required-just open and start working.

Enter your business-specific numbers, including revenue projections, costs, and investment details. The pre-built formulas will automatically calculate financial insights, saving you time and effort.

Leverage the investor-ready format to confidently showcase your financial projections to banks, franchise representatives, or investors. Impress stakeholders with clear, data-driven insights and professional reports.

Leverage the investor-ready format to confidently present your projections to banks, franchise representatives, or investors.