


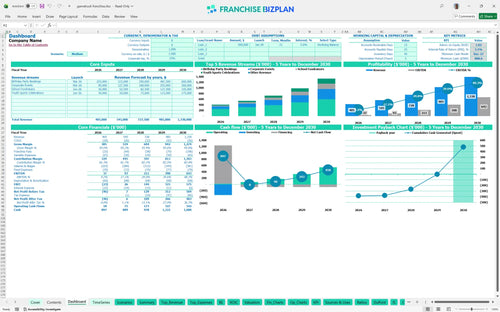
All-in-one Dashboard
Core inputs and core outputs



This comprehensive toolkit provides everything a mobile entertainment operator needs to forecast revenue, manage expenses, and calculate long-term investment returns in one dynamic Excel file.
Core inputs and core outputs
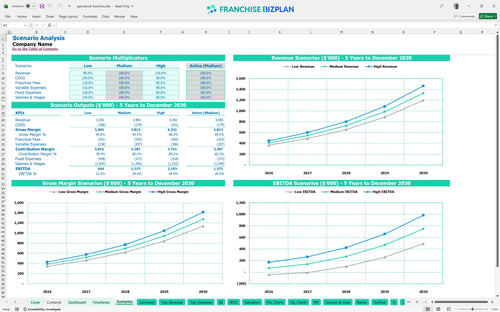
Three scenario analysis
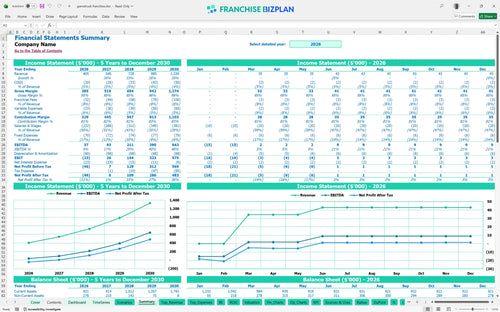
Presentation ready
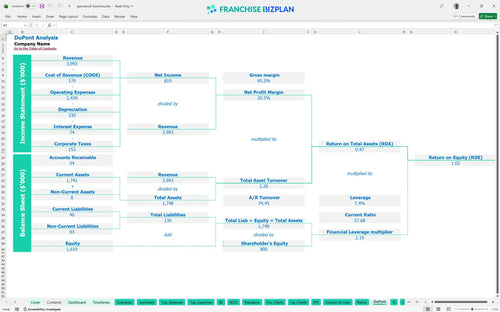
DuPont analysis
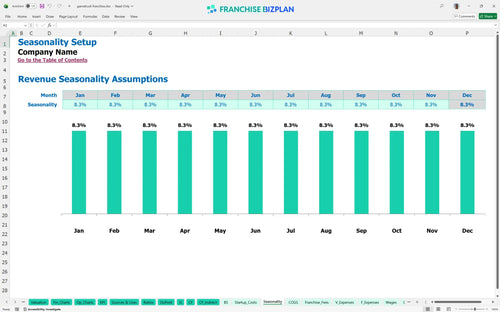
Researched revenue assumptions
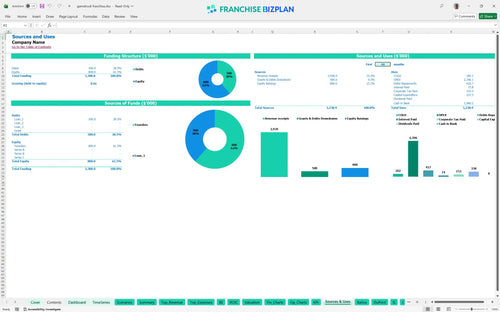
Lender-friendly financial outputs
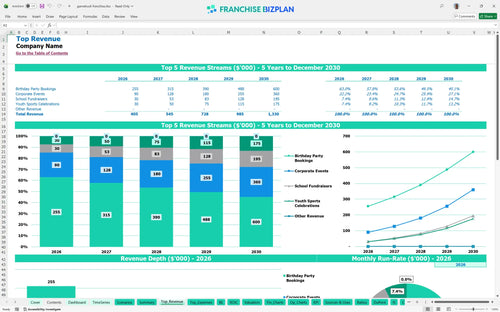
Revenue stream detailed view
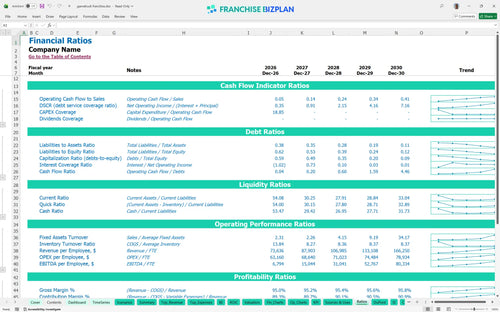
Performance metrics benchmark
We built this financial model using deep-dive research into mobile entertainment economics. The assumptions for revenue streams, mobile business operating expenses, and staffing are pre-populated with data showing Year 1 revenue of $405,000 and a 4-month path to break-even, all of which you can edit.
The unit hits break-even in April 2026, just four months after launch. By Year 1, you are looking at an EBITDA of $37,000, which scales significantly to $643,000 by Year 5 as your local density and booking frequency increase. Profitability is a function of throughput and tight labor control.
To learn how to calculate startup costs for a mobile gaming franchise, you have to look at the $337,500 total initial investment. This covers the $49,500 franchise fee, the $150,000 gaming truck, and $40,000 for the custom wrap and branding. Your biggest check goes to the asset that generates the cash.
Your ROI analysis for franchise owners shows a 5-year payback period and an internal rate of return (IRR) of 3.08%. While the initial return on equity is 1.02, the cash flow scales as the fleet matures and the brand dominates the local territory. A 5-year payback is standard for heavy-asset mobile models.
Small business cash flow forecasting shows you reach break-even in month four. The primary driver is booking volume across your four main revenue streams, especially the high-volume birthday party segment which starts at $170,000 in Year 1. Fixed costs are the enemy of a slow month.
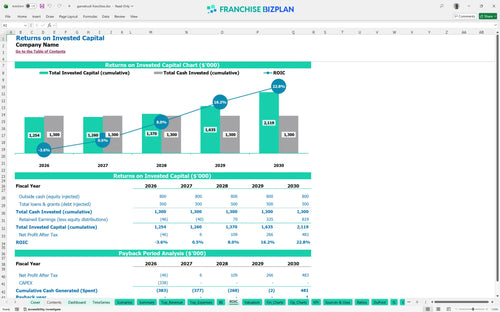
The lowest cash point is $889,000 in December 2027, according to the monthly operating budget template for mobile franchises. This suggests you need a healthy buffer when estimating operating costs for mobile event businesses to handle the ramp-up phase safely. Cash is oxygen, and ramp-up is where most people hold their breath.
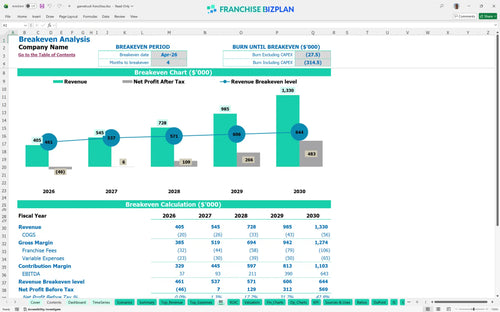
Our mobile gaming business revenue stream analysis shows that hitting the high-case scenario moves Year 5 revenue toward $1.33M. If you miss your marks, the 5-year payback could stretch, so you defintely need to watch the 7% royalty burden. High-case scenarios require relentless local marketing execution.
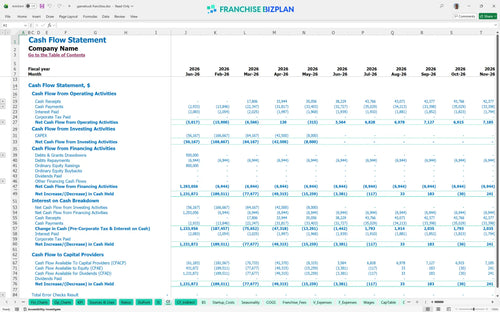
Success in this model depends on your ability to manage the 'GameCoach' staff and maintain the mobile assets. This financial feasibility study for mobile service franchises provides the data you need to move from a prospect to an owner with confidence. Data beats gut feelings every single time.
Finance: update unit break-even and payback model by Friday.
This franchise financial model template is a fully customizable Excel tool designed for precision. You can adjust pre-filled formulas and editable assumptions to match your specific territory, whether you are looking for a franchise business plan Excel or a financial model template for entertainment franchise owners. Every formula is open for your local market tweaks.

Plan your multi-year expansion with a franchise unit financial forecasting spreadsheet that covers five years of performance. We include mobile franchise financial projections and a mobile entertainment business profit and loss template to track your path from launch to maturity. Five years is a lifetime in mobile entertainment, so we plan for the long haul.

Understanding the franchise royalty structure is vital for maintaining store-level margins. This franchise investment analysis tool calculates the 7% royalty and 1% marketing fund contributions automatically based on your gross sales. Royalties are the cost of brand power, but they must be managed.

Use our franchise startup cost calculator to map out your initial outlays and preparing a financial plan for a new franchise location. The model provides a clear break-even analysis, showing exactly when your monthly revenue covers both fixed and variable costs. Speed to breakeven is the only metric that lets you sleep at night.

We built this model to help you evaluate franchise unit profitability against industry standards. By comparing your projected labor and occupancy costs to built-in benchmarks, you can ensure your unit remains competitive and efficient. Benchmarks keep your assumptions from floating into fantasy land.


Simply purchase and download the financial model template, then access it instantly using Microsoft Excel or Google Sheets. No installation or technical expertise required-just open and start working.

Enter your business-specific numbers, including revenue projections, costs, and investment details. The pre-built formulas will automatically calculate financial insights, saving you time and effort.

Leverage the investor-ready format to confidently showcase your financial projections to banks, franchise representatives, or investors. Impress stakeholders with clear, data-driven insights and professional reports.

Leverage the investor-ready format to confidently present your projections to banks, franchise representatives, or investors.