
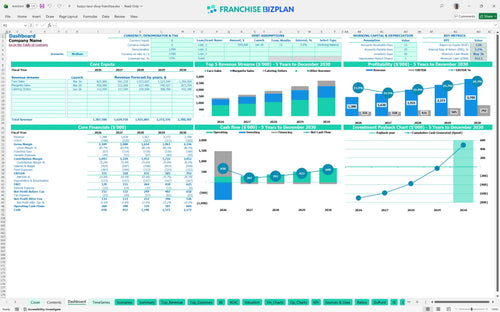
All-in-one Dashboard
Core inputs and core outputs


This comprehensive franchise financial model includes a full suite of pro forma statements, CAPEX trackers, and payroll calculators designed specifically for a high-volume taco shop operation.
Core inputs and core outputs
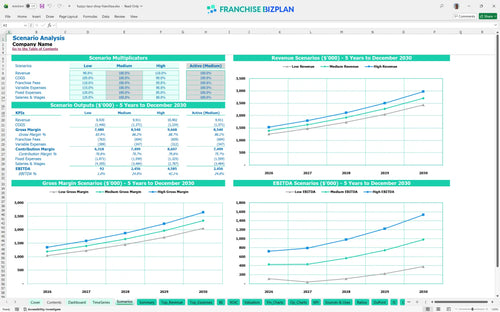
Three scenario analysis
Presentation ready
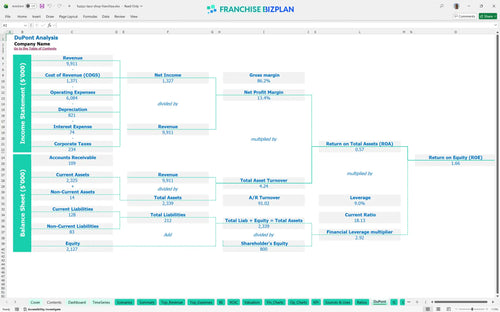
DuPont analysis
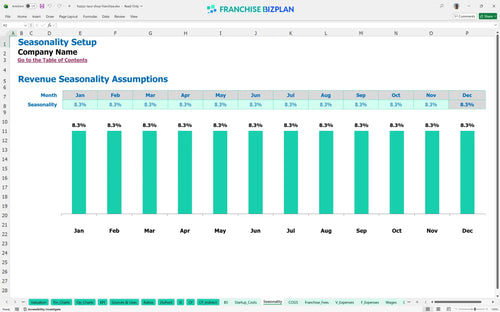
Researched revenue assumptions
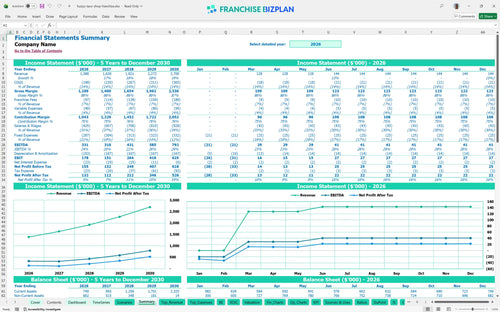
Lender-friendly financial outputs
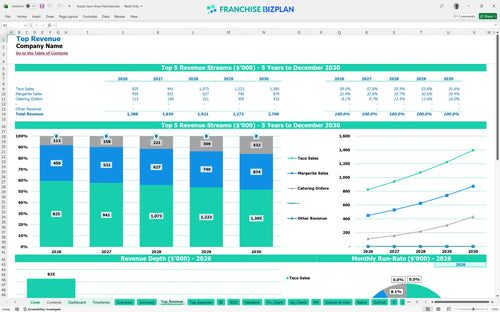
Revenue stream detailed view
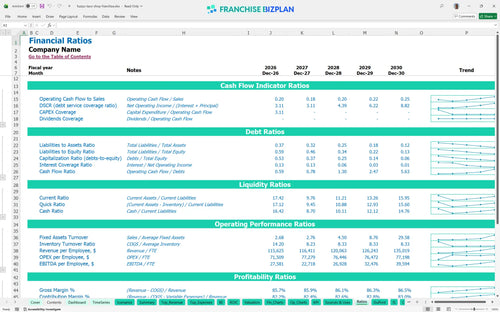
Performance metrics benchmark
We built this franchise unit financial model using our own research into the fast-casual taco sector. Key assumptions, such as the $1,388,000 year-one revenue and 5% royalty fee, are pre-populated with researched data and are fully editable to match your specific location. Honestly, having these numbers ready helps you focus on the brand vibe while we handle the complex math.
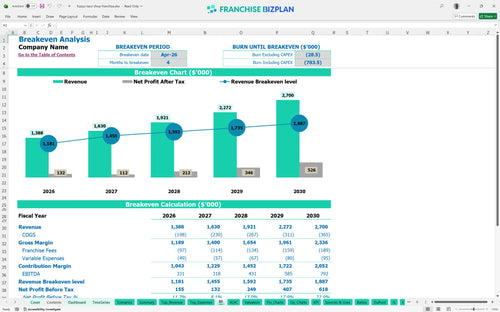
This taco franchise defintely hits its stride early, reaching break-even in April 2026, just 4 months after opening. By evaluating profitability for a new franchise location through a detailed restaurant franchise profit margin analysis, we see Year 1 EBITDA reaching $331,000 as the unit stabilizes.
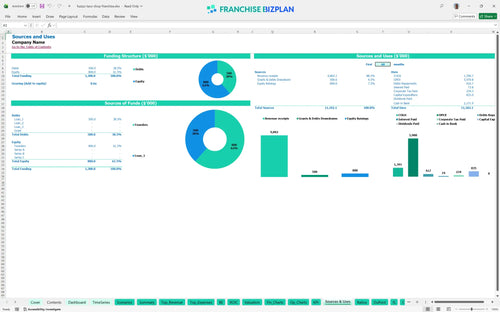
You will need approximately $835,000 to cover the core franchise startup costs, plus a working capital buffer for the first few months. Knowing how to calculate startup costs for a taco franchise accurately ensures you don't run dry before the grand opening in March 2026.
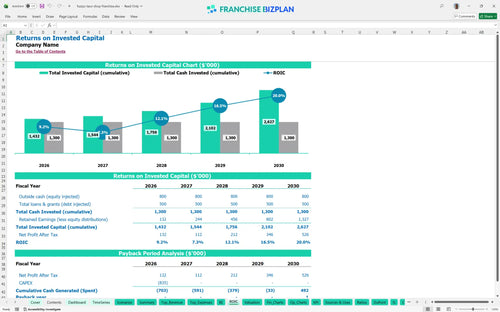
Investors can expect a 5-year payback period and an Internal Rate of Return (IRR) of 3.11% based on current projections. This franchise business investment feasibility study shows that while the initial build-out is significant, the high revenue ceiling of $2.7M by year five drives long-term value.
The unit needs to cover roughly $25,000 in monthly fixed costs, including $18,000 for rent, before accounting for labor and COGS. Using this restaurant franchise breakeven analysis template, we found that volume is the primary driver, making the financial model for fast casual restaurant startup highly sensitive to foot traffic.
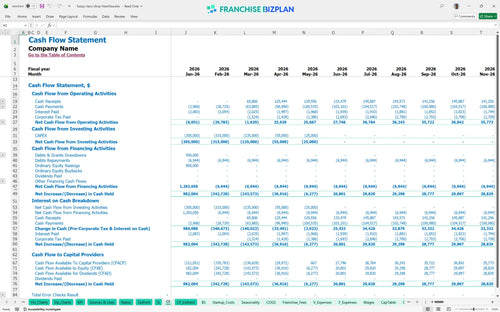
The lowest cash point occurs in May 2026, with a minimum cash balance of $453,000 after the initial ramp-up. Estimating operational costs for a new restaurant franchise properly is vital here, as any delay in the March opening could put additional pressure on your working capital reserves.
The franchise unit performance projection spreadsheet allows you to toggle between Low, Medium, and High cases to see how a 10% swing in taco sales impacts your bottom line. Still, the high-growth scenario significantly accelerates your payback and pushes Year 5 EBITDA toward the $792,000 mark.
This franchise financial model is a fully customizable Excel template for restaurant franchise financial planning, featuring pre-filled formulas and editable assumptions. You can easily adjust the drivers to match your specific territory, ensuring the projections reflect your local market conditions and site-specific costs.

Plan for long-term growth with detailed 5-year restaurant financial projections that cover revenue, costs, and cash flow. This profit and loss statement and cash flow forecasting tool help you visualize the transition from a single-unit startup to a mature, high-performing location or even a small multi-unit chain.

The model accurately tracks your unit economics by accounting for all brand-specific obligations, including the initial $40,000 fee and ongoing franchise royalty fees. By baking in the 5% royalty and 2% marketing fund contributions, you get a realistic view of your store-level margin after all corporate overhead is paid.

Estimate your total franchise startup costs and use the franchise investment calculator to determine exactly how much capital you need to get the doors open. The model identifies your monthly fixed and variable costs, showing you the precise sales volume required to reach the break-even point and start generating positive cash flow.

We have included standardized restaurant financial forecasting model benchmarks to help you sanity-check your restaurant operating expenses against industry norms. This allows you to compare your projected labor, rent, and gross margins to typical fast-casual performance, ensuring your business plan is grounded in reality.


Simply purchase and download the financial model template, then access it instantly using Microsoft Excel or Google Sheets. No installation or technical expertise required-just open and start working.

Enter your business-specific numbers, including revenue projections, costs, and investment details. The pre-built formulas will automatically calculate financial insights, saving you time and effort.

Leverage the investor-ready format to confidently showcase your financial projections to banks, franchise representatives, or investors. Impress stakeholders with clear, data-driven insights and professional reports.

Leverage the investor-ready format to confidently present your projections to banks, franchise representatives, or investors.