
All-in-one Dashboard
Core inputs and core outputs


The Excel template for franchise unit cash flow projections provides a professional, data-driven framework for analyzing the full lifecycle of a restoration business from startup to maturity.
Core inputs and core outputs
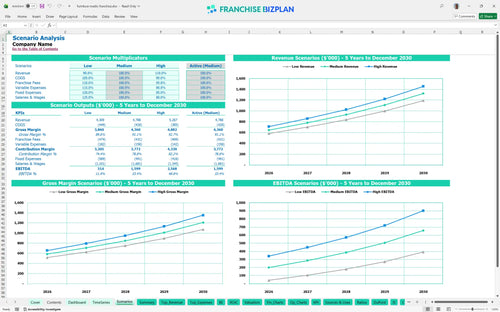
Three scenario analysis
Presentation ready
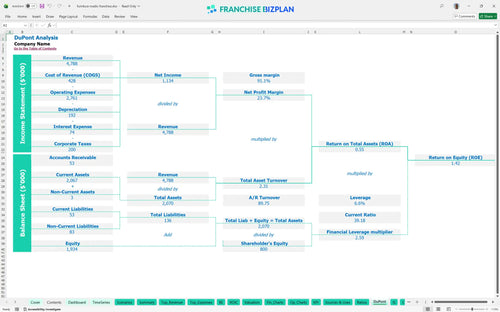
DuPont analysis
Researched revenue assumptions
Lender-friendly financial outputs
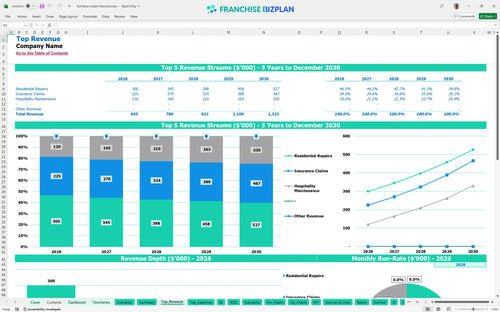
Revenue stream detailed view
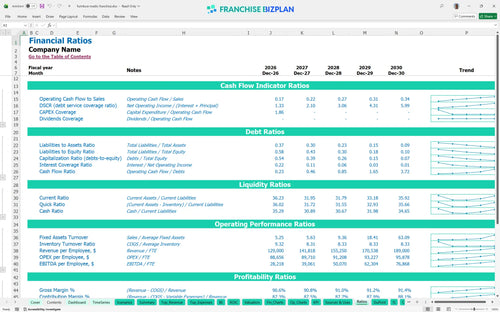
Performance metrics benchmark
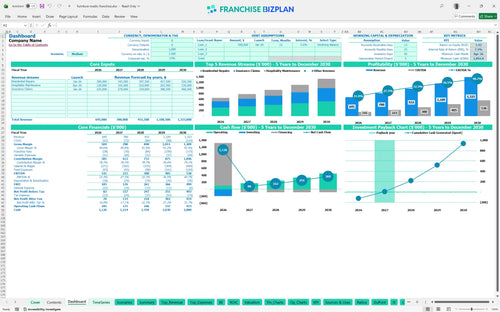
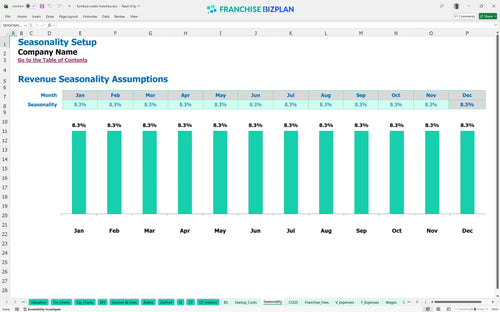
We developed this financial model template for home service franchise units based on extensive market research. The core assumptions for this recurring revenue business model-including residential repairs, hospitality contracts, and insurance claims-are pre-populated with realistic data but remain fully editable for your specific market. With Year 1 revenue projected at $645,000 and EBITDA at $141,000, this model provides a practical baseline for your investment decision.
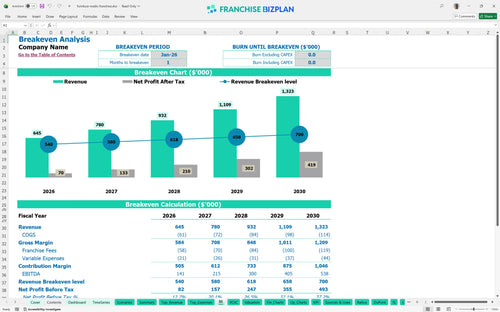
This unit is designed for rapid profitability analysis for professional furniture repair, showing a breakeven date as early as January 2026. By Year 3, the model forecasts an EBITDA of $300,000, driven by the expansion of the technician team and increased insurance claim volume.
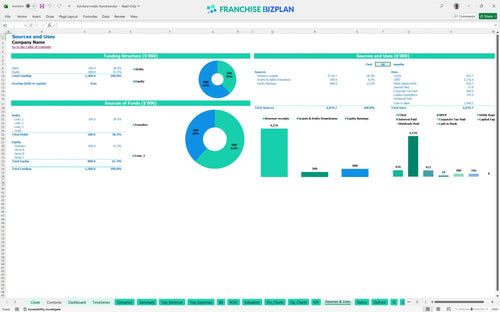
Launching this unit requires a total franchise unit capital expenditure plan that accounts for a minimum cash need of $1,093,000. This covers the initial $50,000 franchise fee, $80,000 for two branded service vans, and specialized tools to ensure you can deliver white-glove service from day one.
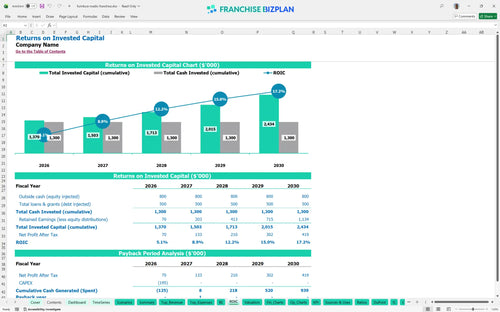
The franchise investment ROI analysis indicates a 2-year payback period, which is efficient for a service-based business. With an Internal Rate of Return (IRR) of 7.17% and a Return on Equity (ROE) of 1.42, the model shows a stable path to recouping your initial capital while building long-term equity.
The franchise unit break-even analysis spreadsheet shows you hit the break-even point in just one month. To maintain this, you must manage fixed costs like the $3,800 monthly rent and $65,000 operations manager salary by ensuring your technicians stay billable for a majority of their shifts.
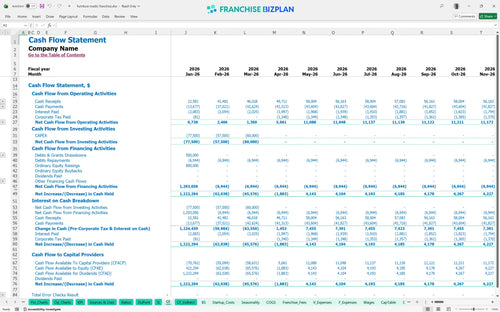
Your lowest cash point is projected for April 2026 during the initial ramp-up phase. You defintely need to monitor budgeting for mobile service fleet operational costs closely during these first few months to ensure the $1,093,000 minimum cash buffer remains intact as you scale your staff.
Revenue forecasting for mobile business franchise owners shows that a 10% swing in insurance claim volume significantly impacts Year 1 margins. Using these financial forecasting tools for independent franchise owners, you can see how hitting the 'High' case through superior local marketing execution can push Year 5 EBITDA toward $538,000.
Finance: update unit break-even and payback model by Friday.
This franchise financial model template is built in Excel to give you complete control over your planning. We have included pre-filled formulas and editable assumptions so you can easily adjust the numbers for your specific territory, whether you are figuring out how to build a financial plan for a new franchise or refining an existing operation.

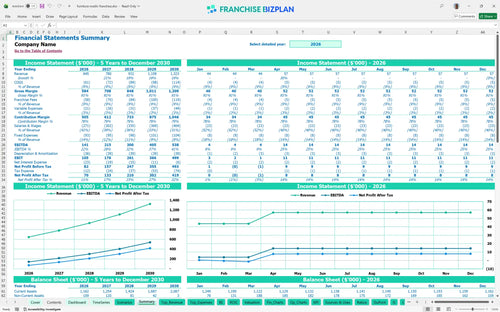
Long-term success in the restoration industry requires more than just a one-year view. This franchise profit and loss template provides a detailed 5-year outlook on revenue, costs, and cash flow, helping you see how a small business financial projection spreadsheet can map the growth from your first branded van to a full multi-tech fleet.

Managing the 'off-the-top' costs is critical for maintaining store-level margins. Our model specifically tracks the franchise royalty fee structure, including the 7% royalty and 2% marketing fund contributions, so you can see exactly how much cash remains after meeting your brand obligations.

This franchise startup cost calculator helps you visualize the total investment needed before you open your doors. By learning how to calculate startup costs for a mobile repair franchise, you can plan for the $50,000 franchise fee and equipment needs while identifying the exact sales volume required to cover your monthly fixed costs.

We have integrated operational expense forecasting and benchmarks directly into the furniture restoration business plan. This allows you to sanity-check your numbers against industry standards, especially when estimating labor costs for furniture restoration businesses or evaluating your material spend relative to total revenue.


Simply purchase and download the financial model template, then access it instantly using Microsoft Excel or Google Sheets. No installation or technical expertise required-just open and start working.

Enter your business-specific numbers, including revenue projections, costs, and investment details. The pre-built formulas will automatically calculate financial insights, saving you time and effort.

Leverage the investor-ready format to confidently showcase your financial projections to banks, franchise representatives, or investors. Impress stakeholders with clear, data-driven insights and professional reports.

Leverage the investor-ready format to confidently present your projections to banks, franchise representatives, or investors.