
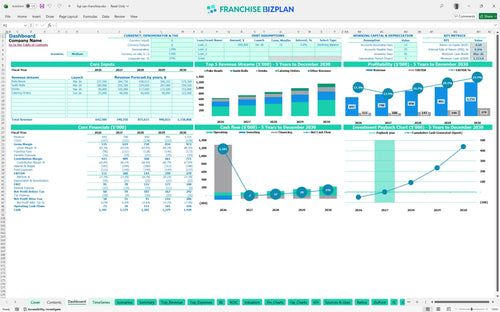
All-in-one Dashboard
Core inputs and core outputs


This franchise unit financial model template provides a complete roadmap for operating a high-volume food kiosk, from initial buildout to five-year exit planning.
Core inputs and core outputs
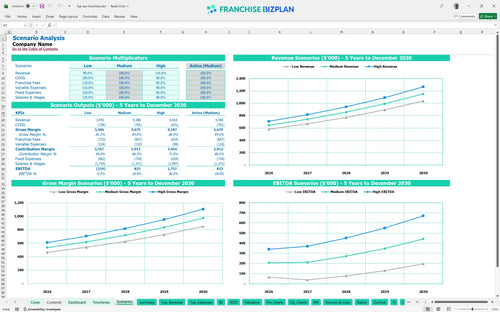
Three scenario analysis
Presentation ready
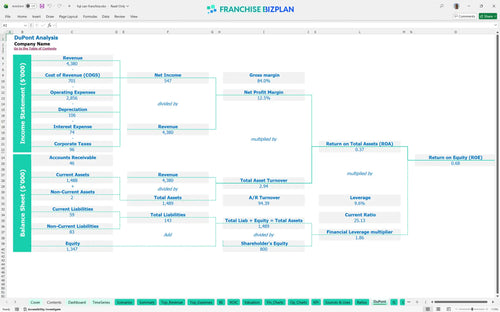
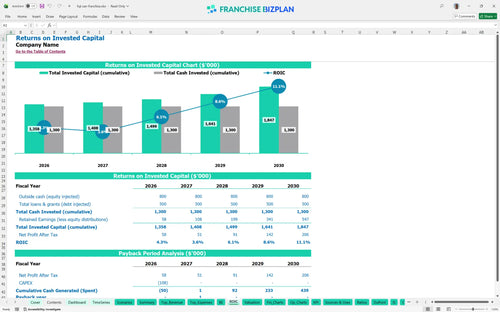
DuPont analysis
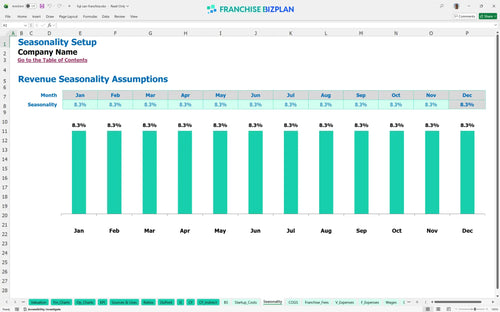
Researched revenue assumptions
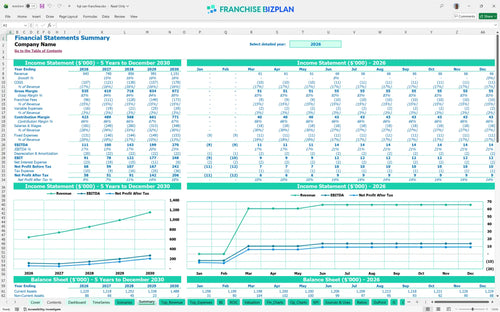
Lender-friendly financial outputs
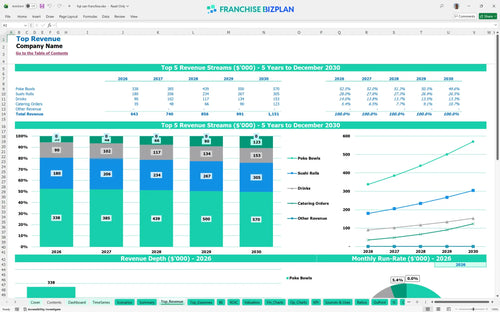
Revenue stream detailed view
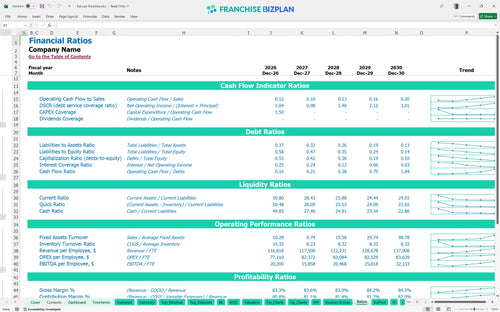
Performance metrics benchmark
We built this model using detailed research into high-traffic retail food operations to ensure your projections are grounded in real-world data. The model is pre-populated with specific assumptions like a $643,000 year-one revenue target and a 15% royalty structure, but every cell remains fully editable for your specific territory. Honestly, having these numbers ready to go saves you dozens of hours of research and spreadsheet building.
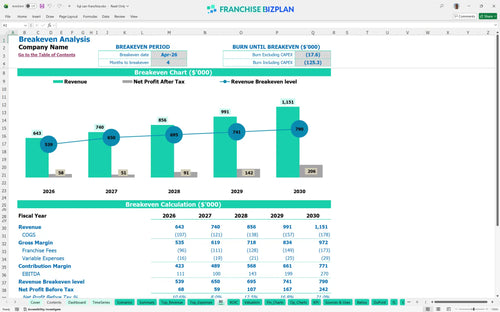
The unit reaches profitability in Year 1 with an EBITDA of $111,000, though this dips slightly to $100,000 in Year 2 as staffing levels for sushi chefs and frontline workers increase to support growth. By Year 5, the profitability analysis for quick-service food kiosks shows EBITDA scaling to $270,000 as catering orders reach $123,000 annually. Here is the quick math: your net margin improves significantly once you move past the initial ramp-up phase and stabilize labor costs.
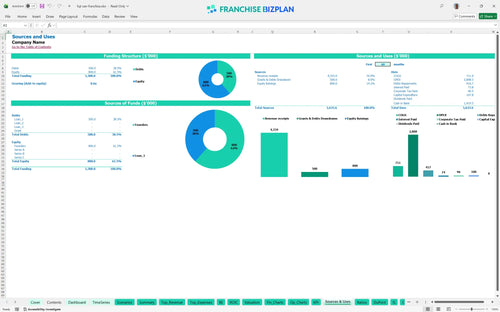
A financial feasibility study for new franchise owners shows you need approximately $107,750 for the initial physical setup, plus a significant cash buffer for the ramp-up period. This franchise investment analysis includes $40,000 for the kiosk buildout and $15,000 for refrigeration units to keep seafood fresh. To be fair, your total liquidity needs will be higher to cover the minimum cash requirements during the first few months of trading.
You can expect a 2-year payback period and an Internal Rate of Return (IRR) of 6.65%, which is a solid baseline for a single-unit retail food operation. Calculating ROI for food and beverage franchise locations shows a Return on Equity (ROE) of 0.68, meaning the business is defintely generating value relative to the capital invested. Still, the real wealth is built in the out-years as EBITDA nearly triples between Year 2 and Year 5.
The revenue forecasting template for small food businesses indicates a break-even date of April 2026, just four months after your January launch. This fast start is driven by the high-visibility location and immediate demand for Poke Bowls and Sushi Rolls, which combined represent $345,000 in Year 1 sales. Your biggest hurdle to break-even is the $7,500 monthly rent, so hitting your daily traffic counts from day one is critical.
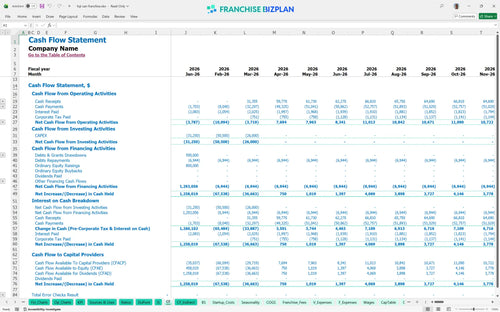
The Excel spreadsheet for franchise financial forecasting identifies March 2026 as your lowest cash point, with a minimum cash balance of $1,154,000. This suggests you need a substantial capital reserve to handle the gap between the January buildout and the April break-even. Plus, keeping a buffer helps you navigate the 15% royalty payments that start as soon as you begin ringing up sales.
A comprehensive financial plan for a retail food kiosk must account for volatility; in a high-revenue scenario, your Year 5 EBITDA could exceed $300,000 if catering demand spikes. Estimating operating costs for a retail sushi franchise shows that even in a low scenario, the 15% royalty and fixed $7,500 rent remain constant, which can squeeze margins quickly if traffic drops. The difference between a good and great year usually comes down to managing the 1.5% payment processing fees and delivery commissions.
This franchise financial model is built in Excel with fully editable assumptions, allowing you to swap out our researched data for your specific site-level numbers. You can adjust every driver from hourly wages to local seafood costs, and the pre-filled formulas will instantly update your entire five-year outlook. It is a flexible tool designed to handle the unique variables of a food kiosk business model without requiring advanced accounting skills.

Plan your growth with confidence using detailed five-year projections that track revenue climbing from $643,000 in year one to over $1.15 million by year five. The model includes a full capital expenditure forecast to help you manage the timing of equipment replacements and kiosk refreshes. This long-term view ensures you understand how store-level margins evolve as your team hits peak throughput and operational efficiency.

Managing franchise royalty and operating expenses in excel is simplified with dedicated inputs for the 15% royalty fee and initial $3,750 franchise fee. The model tracks these obligations against your gross sales to show exactly how much cash remains for local operations and debt service. By automating these calculations, you can see the impact of the royalty burden on your bottom line as catering and retail sales scale.

Our franchise startup cost breakdown template covers everything from the $40,000 kiosk buildout to the $20,000 kitchen equipment package. You will see exactly how much capital is required before the doors open, including signage, POS systems, and furniture. This section maps out your total franchise startup costs so you can secure financing and set realistic expectations for your initial cash outlay.

The model uses franchise unit economics and operational budget planning benchmarks to help you sanity-check your seafood ingredient costs, which start at 14.5% of sales. We have included standard ranges for prime kiosk rent at $7,500 per month and utilities to ensure your projections stay grounded in reality. These benchmarks act as a guardrail, highlighting if your labor or supply costs drift too far from industry norms.


Simply purchase and download the financial model template, then access it instantly using Microsoft Excel or Google Sheets. No installation or technical expertise required-just open and start working.

Enter your business-specific numbers, including revenue projections, costs, and investment details. The pre-built formulas will automatically calculate financial insights, saving you time and effort.

Leverage the investor-ready format to confidently showcase your financial projections to banks, franchise representatives, or investors. Impress stakeholders with clear, data-driven insights and professional reports.

Leverage the investor-ready format to confidently present your projections to banks, franchise representatives, or investors.