
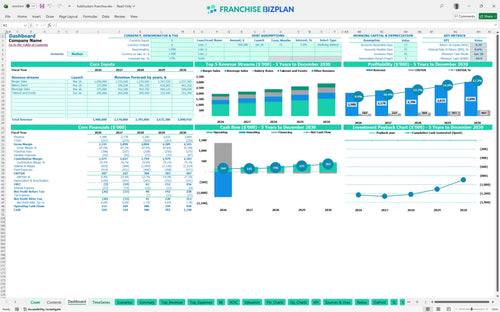
All-in-one Dashboard
Core inputs and core outputs


This Excel template for restaurant franchise financial projections provides a total look at unit-level performance from day one through year five.
Core inputs and core outputs
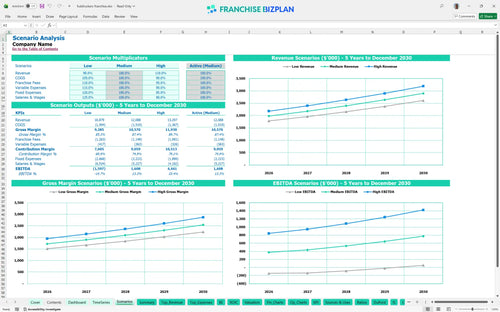
Three scenario analysis
Presentation ready
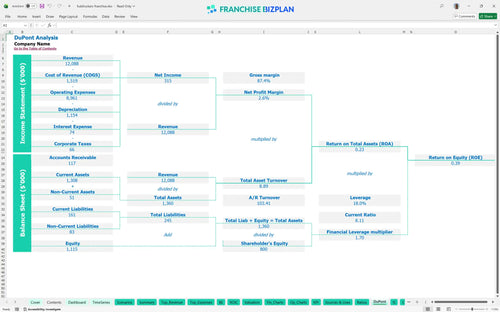
DuPont analysis
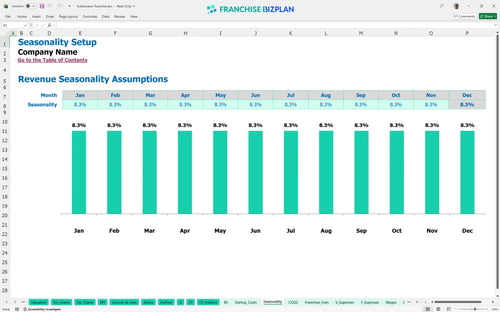
Researched revenue assumptions
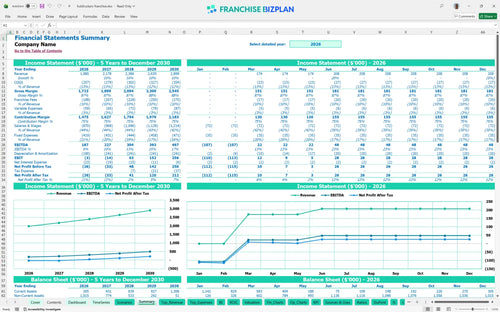
Lender-friendly financial outputs
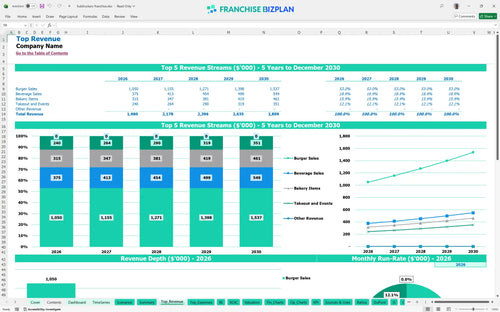
Revenue stream detailed view
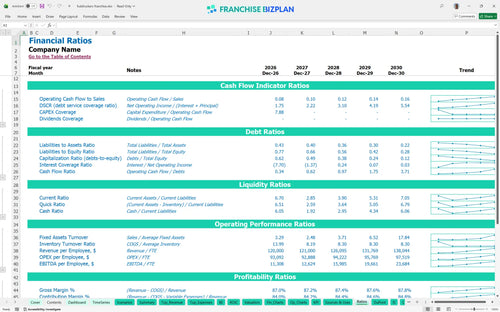
Performance metrics benchmark
We built this franchise unit financial model using our own research into premium burger operations. Key assumptions like the $1.98M year-one revenue target and the 9.5% combined royalty and marketing fees are pre-populated and fully editable. This tool helps you move from guessing to knowing your store-level margin.
Based on our research, this unit hits EBITDA positivity in year one at $187,000, with net profit scaling as burger sales grow by 10% annually. By year five, EBITDA reaches $497,000, but you have to manage the 9.5% combined royalty and marketing load. True wealth in this model is built in the later years as the brand matures.
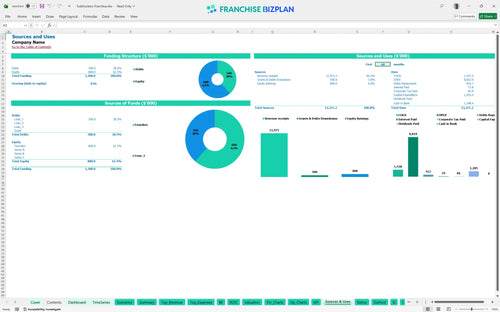
You will need roughly $1.2M to get the doors open, covering everything from the $45,000 initial fee to the heavy $500,000 leasehold improvement cost. The kitchen and bakery equipment alone represent a $370,000 investment. Honestly, you should defintely have a cash buffer for the $70,000 dip expected in month four.
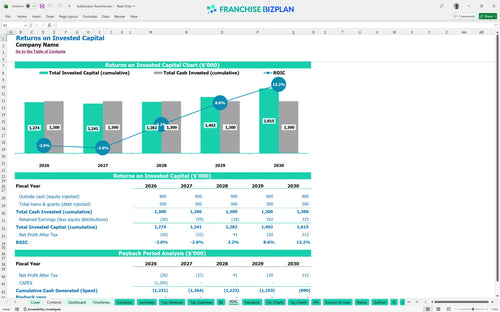
The return on equity sits at 0.39, but the payback period extends past the five-year mark due to the high initial capex. While the IRR is a modest 0.6% in this specific five-year window, the value lies in the stable cash flow from the $2.8M top line. This is a long-term play for a multi-unit operator rather than a quick flip.
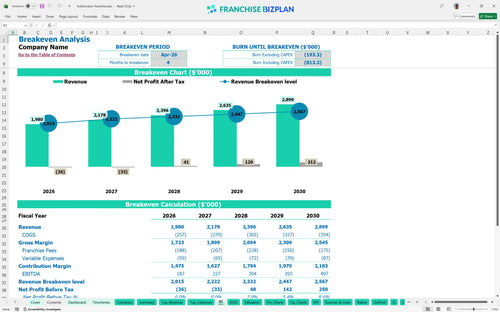
You hit the break-even date in April 2026, just four months after launching. The biggest driver for this is the high average ticket from premium burger sales and bakery items. If your $22,000 monthly rent stays fixed, hitting your volume targets is the only way to protect that store-level margin.
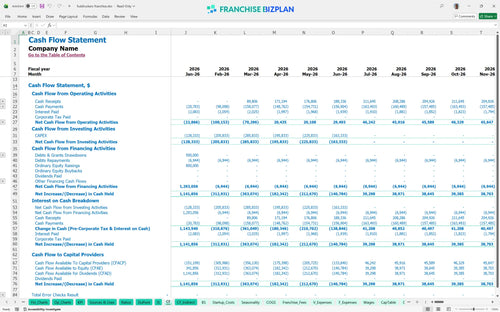
Your lowest cash point occurs in June 2026 with a $70,000 deficit, meaning you need adequate working capital from the start. Estimating labor costs for premium burger restaurants is tricky during the ramp-up, so watching that $100k GM salary and staff count is vital. Still, the runway stabilizes once the takeout and events revenue kicks in.
Evaluating profitability of hybrid dining restaurant models means looking at what happens if sales drop 10%. In a low scenario, your $187,000 year-one EBITDA could vanish, while a high scenario with better local marketing execution could push you toward that $497,000 mark faster. The model lets you toggle these inputs to see the impact on peak cash need.
This franchise financial model template is built in Excel so you can tweak every variable to fit your specific territory. Whether you are adjusting the burger sales forecast or changing the head baker's salary, the pre-filled formulas update instantly. It is basically a sandbox for your restaurant franchise startup costs and revenue goals.

Planning for a burger restaurant business plan requires a long-term view of how your unit scales from year one to year five. We map out everything from the initial $1.98M revenue start to the projected $2.899M maturity phase. This helps you see how food service financial forecasting impacts your bottom line as the brand matures.

Operating a major brand means managing a specific franchise royalty fee structure that eats into your gross margin. This model accounts for the 5.5% royalty and 4% marketing fee every single month. It is vital to see how these off-the-top costs interact with your local marketing and events spend.

Knowing how to calculate startup costs for a burger franchise is the first step to avoiding a cash crunch. With over $1.2M in initial capital needed for leaseholds and equipment, you need a break-even analysis tool that shows exactly when you stop bleeding cash. Here is the reality: your first few months are about survival until you hit that volume sweet spot.

We use restaurant unit economics to ensure your labor and food costs stay within healthy ranges. If your food ingredients are hitting 11% and labor is climbing, the model flags it against standard restaurant franchise revenue forecasting spreadsheet norms. It keeps your projections grounded in what actually happens on the kitchen floor.


Simply purchase and download the financial model template, then access it instantly using Microsoft Excel or Google Sheets. No installation or technical expertise required-just open and start working.

Enter your business-specific numbers, including revenue projections, costs, and investment details. The pre-built formulas will automatically calculate financial insights, saving you time and effort.

Leverage the investor-ready format to confidently showcase your financial projections to banks, franchise representatives, or investors. Impress stakeholders with clear, data-driven insights and professional reports.

Leverage the investor-ready format to confidently present your projections to banks, franchise representatives, or investors.