
All-in-one Dashboard
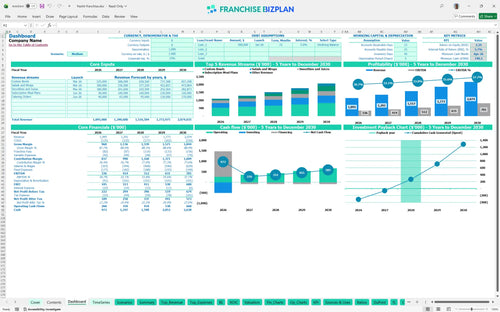
Core inputs and core outputs


This comprehensive package includes a detailed restaurant franchise financial projections template designed to handle everything from initial build-out costs to five-year cash flow management.
Core inputs and core outputs
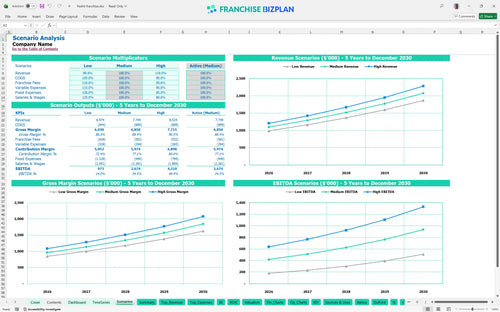
Three scenario analysis
Presentation ready
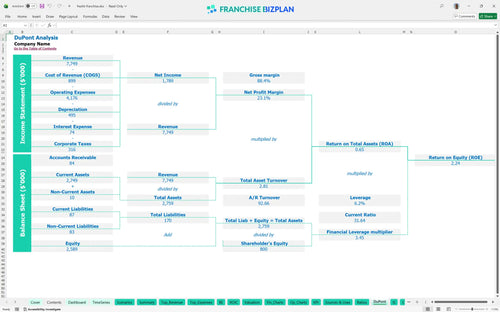
DuPont analysis
Researched revenue assumptions
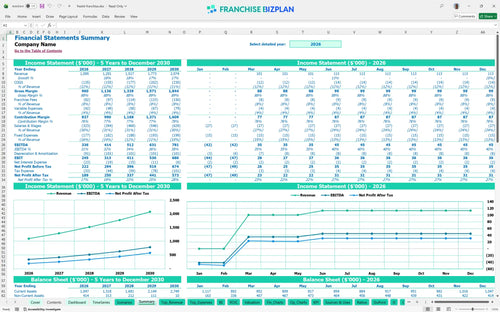
Lender-friendly financial outputs
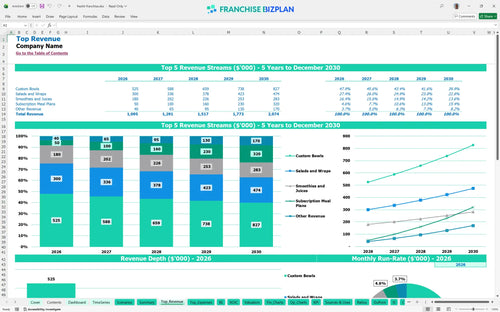
Revenue stream detailed view
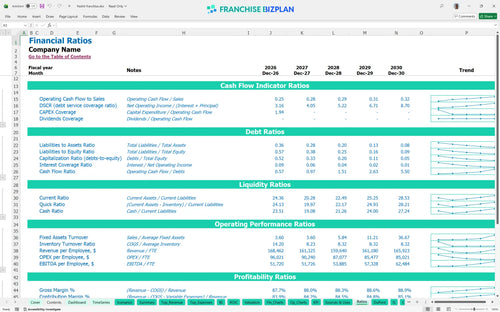
Performance metrics benchmark
We built this health food franchise financial model template using detailed research to ensure your projections are grounded in reality. Key assumptions, including the $1.09M year-one revenue target and the 6% royalty structure, are pre-populated and fully editable to help you perform a realistic franchise profitability analysis.
This unit is projected to reach profitability in its first year, with an initial EBITDA of $336,000. By year three, the model shows EBITDA climbing to $512,000 as revenue from custom bowls and catering scales, assuming you maintain tight control over food and labor costs.
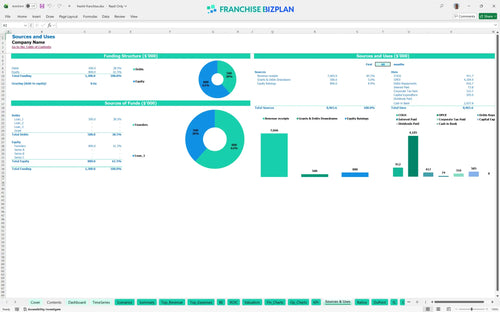
You will need approximately $495,000 to launch this unit, covering the $30,000 franchise fee and $220,000 in leasehold improvements. This total also accounts for $110,000 in kitchen equipment and $35,000 for specialized station setups to ensure operational readiness from day one.
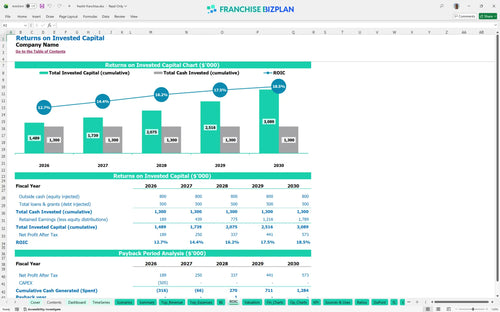
Based on current projections, you can expect a 3-year payback period on your initial investment. The model calculates an Internal Rate of Return (IRR) of 5.68% and a Return on Equity (ROE) of 2.24, providing a clear picture of the long-term value for owners and investors.
The unit hits its monthly break-even point in April 2026, just four months after opening. This quick turnaround depends heavily on managing the $9,000 monthly rent and calculating royalty and marketing fees in franchise model accurately against your daily traffic volume.
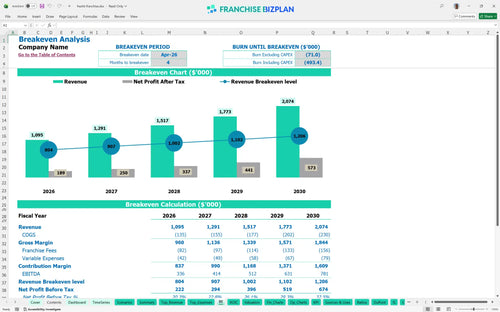
The lowest cash point occurs in April 2026 at $740,000, which includes your initial capital and early operating losses. You should maintain a small buffer to handle the 4-month ramp-up period and ensure you can cover the $12,700 in monthly fixed costs during the quietest weeks.
In the high-growth scenario, year-one revenue can exceed the $1.09M base, significantly accelerating your 3-year payback. Low-performing scenarios might extend the break-even date past April 2026, so monitoring the 10.5% food cost and 6% royalty burden is essential for maintaining a positive cash flow projection template.
Finance: update unit break-even and payback model by Friday.
This franchise financial model is built in Excel with a focus on flexibility, allowing you to adjust every variable from foot traffic to menu pricing. You can use the pre-filled formulas and editable assumptions to create a precise franchise unit economic model that reflects your specific territory and local market conditions.

Planning for long-term growth requires more than a simple spreadsheet; you need a view of how your unit scales over half a decade. This tool provides detailed 5-year revenue forecasts, showing a trajectory from $1.09M in year one to over $2.07M by year five, ensuring your unit-level economics remain sustainable as the market matures.

Managing the financial obligations to the franchisor is critical for maintaining your store-level margin. The model automatically calculates the 6% royalty and 1.5% marketing fund contributions based on your gross sales, so you defintely see the impact of these fees on your bottom line before you sign a lease.

Estimating your total initial investment is the first step to securing funding and managing your runway. Use this food franchise startup costs excel tool to map out everything from the $30,000 franchise fee to the $220,000 leasehold improvements, identifying exactly when your monthly sales will cover both fixed and variable costs.

We have incorporated industry-standard benchmarks to help you sanity-check your operating costs against successful units. By comparing your labor costs and gross margins to these established ranges, you can identify potential margin leaks in your franchise unit business model financial forecasting before they impact your cash flow.


Simply purchase and download the financial model template, then access it instantly using Microsoft Excel or Google Sheets. No installation or technical expertise required-just open and start working.

Enter your business-specific numbers, including revenue projections, costs, and investment details. The pre-built formulas will automatically calculate financial insights, saving you time and effort.

Leverage the investor-ready format to confidently showcase your financial projections to banks, franchise representatives, or investors. Impress stakeholders with clear, data-driven insights and professional reports.

Leverage the investor-ready format to confidently present your projections to banks, franchise representatives, or investors.