
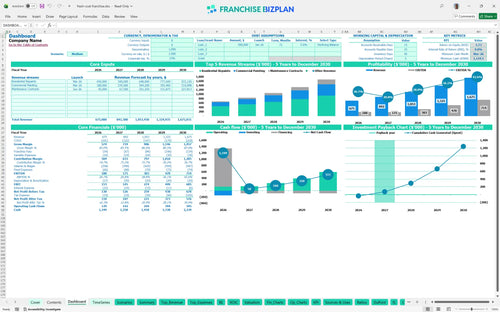
All-in-one Dashboard
Core inputs and core outputs


This painting franchise startup costs tool provides a detailed roadmap for managing cash flow, payroll, and growth targets over a five-year horizon.
Core inputs and core outputs
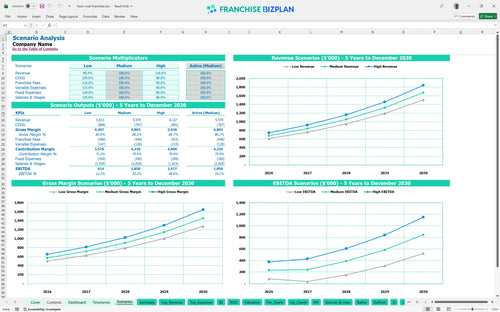
Three scenario analysis
Presentation ready
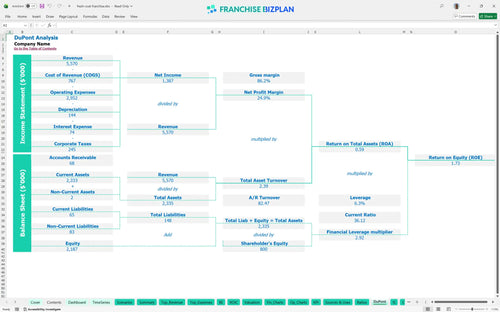
DuPont analysis
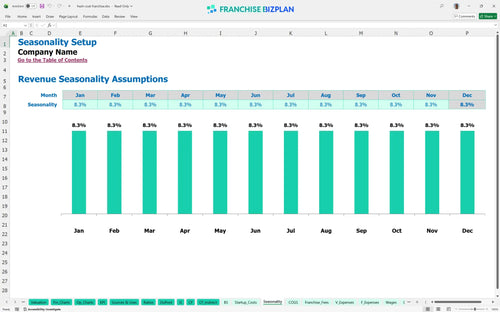
Researched revenue assumptions
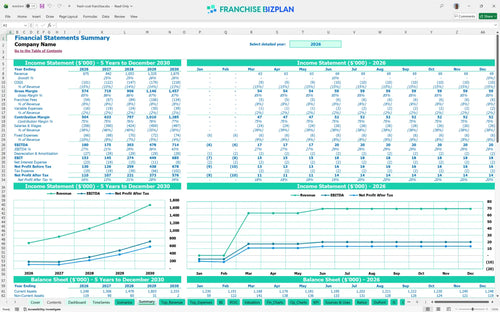
Lender-friendly financial outputs
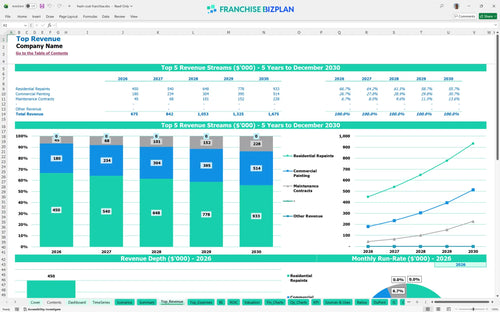
Revenue stream detailed view
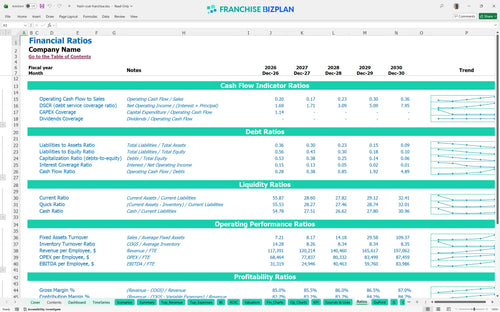
Performance metrics benchmark
We developed this franchise unit financial model using our own research into the home improvement sector. Key assumptions, including residential repaints and commercial painting revenue streams, are pre-populated with data showing a year-one revenue target of $675,000 and a 6% royalty structure. These inputs are fully editable, providing a best financial planning tools for new franchise owners experience.
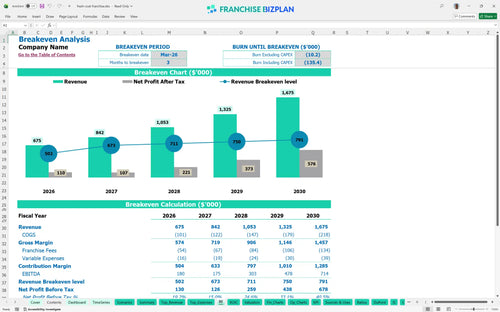
You can expect to hit profitability quickly, with the model showing a break-even date in March 2026, just three months after launch. By year three, EBITDA is projected to reach $303,000 as you scale into more maintenance contracts and commercial work while managing a franchise unit profitability analysis.
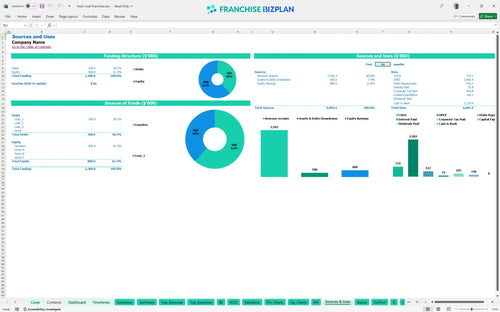
To get the doors open, you must account for a total initial investment that includes a $49,900 franchise fee and $42,000 for company vehicles. This startup budget template for professional painting businesses also factors in $18,500 for equipment and $12,000 for your office setup to ensure you are fully operational from day one.
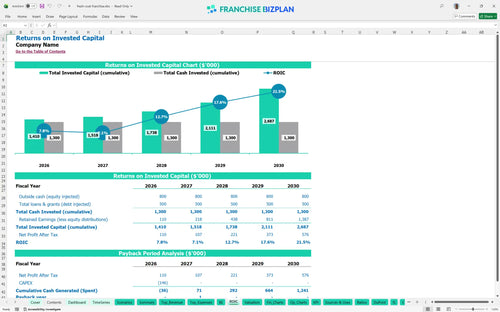
Assessing profitability of a home services franchise opportunity requires looking at the long-term gains. This model projects an Internal Rate of Return (IRR) of 9.02% and a Return on Equity (ROE) of 1.73, with a full payback of your initial investment within two years based on our financial performance representation analysis for franchisees.
Your monthly break-even happens in March 2026, driven largely by your ability to secure residential repaints. Since fixed costs like warehouse rent at $2,500 and insurance at $2,000 are relatively stable, your speed to break-even depends on how fast your sales coordinator can fill the pipeline.
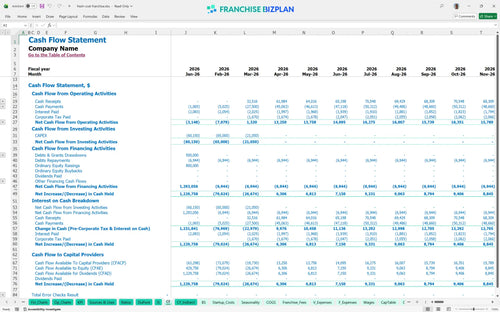
The lowest cash point occurs in March 2026, with a minimum cash balance of $1,124,000 projected. While this seems high, it ensures you have the working capital to handle the ramp-up of your painters and the initial marketing push needed to grab local market share through cash flow forecasting for contractors.
A detailed revenue projection spreadsheet for painting business needs to account for market shifts. If you hit the high-growth scenario, your year-5 revenue could exceed the $1.675M base case, which will defintely shorten your payback period and boost your ROE while following a financial model template for home improvement franchise owners.
This franchise financial model template is built in Excel, allowing you to tweak every variable from crew wages to local rent. You can adjust the pre-filled formulas to match your specific territory, whether you are hiring more painters or shifting your focus toward the commercial painting business model.

Planning for the long haul is easier when you see how revenue scales from $675,000 in year one to over $1.6 million by year five. This small business financial projection spreadsheet tracks your transition from a startup to a mature operation, helping you understand how to build a 5-year financial forecast for a service franchise.

Understanding franchise royalty fees and operational expenses is vital for protecting your margins. The model automatically calculates the 6% royalty and 2% marketing fund contributions based on your projected revenue, so you know exactly what stays in your pocket after the franchisor gets paid.

Calculating break-even point for a new franchise location helps you manage your initial runway. We have mapped out the $49,900 franchise fee along with vehicle and equipment costs to show you exactly when your monthly revenue covers your fixed overhead and provides a clear ROI calculation for franchise investment.

This model uses unit economics for service franchises to help you sanity-check your numbers. By comparing your paint costs-starting around 12.5%-and labor expenses against industry norms, you can spot where your operation might be leaking cash before it becomes a problem.


Simply purchase and download the financial model template, then access it instantly using Microsoft Excel or Google Sheets. No installation or technical expertise required-just open and start working.

Enter your business-specific numbers, including revenue projections, costs, and investment details. The pre-built formulas will automatically calculate financial insights, saving you time and effort.

Leverage the investor-ready format to confidently showcase your financial projections to banks, franchise representatives, or investors. Impress stakeholders with clear, data-driven insights and professional reports.

Leverage the investor-ready format to confidently present your projections to banks, franchise representatives, or investors.