
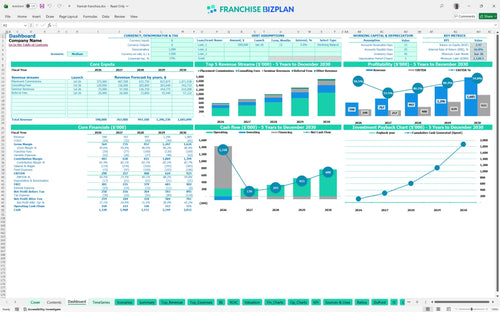
All-in-one Dashboard
Core inputs and core outputs


This Excel template for franchise investment return analysis includes detailed tabs for revenue modeling, payroll planning, CAPEX tracking, and five-year financial statements designed for professional-grade due diligence.
Core inputs and core outputs
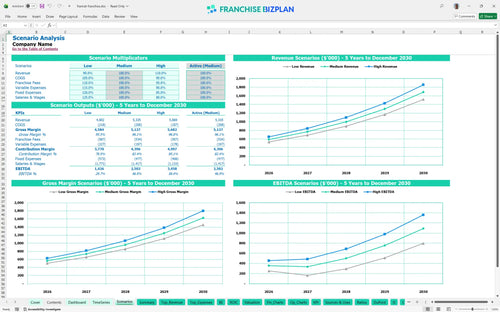
Three scenario analysis
Presentation ready
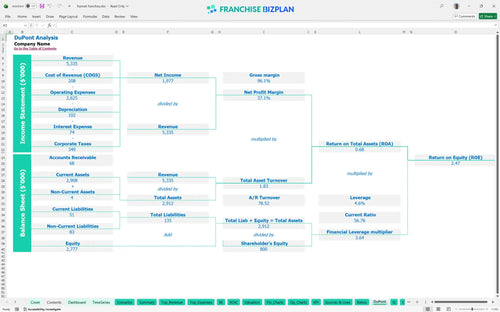
DuPont analysis
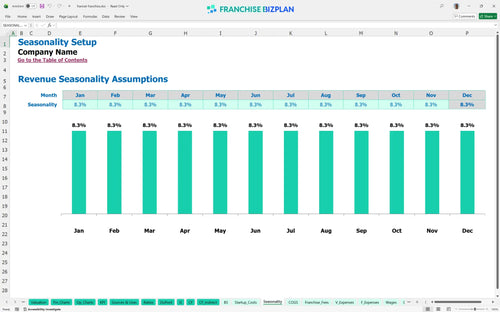
Researched revenue assumptions
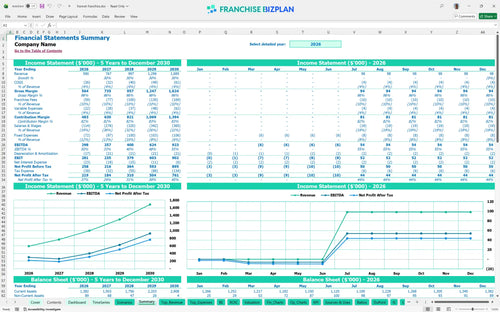
Lender-friendly financial outputs
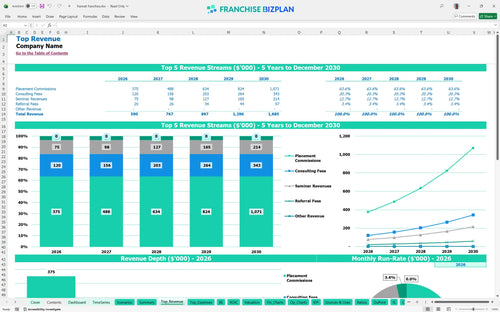
Revenue stream detailed view
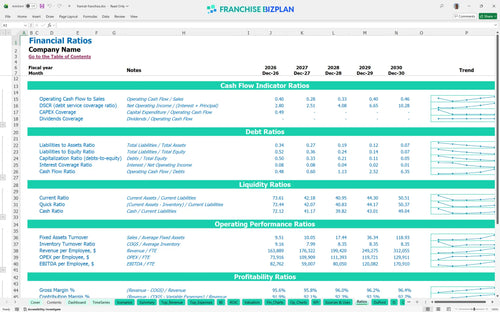
Performance metrics benchmark
We built this franchise unit financial model using our own research to provide a realistic roadmap for your consultancy hub. Key assumptions like the $590,000 year-one revenue target and the 10% royalty structure are pre-populated and fully editable to match your specific territory. This tool helps you move beyond the franchise disclosure document analysis to see the actual cash flow potential of the business.
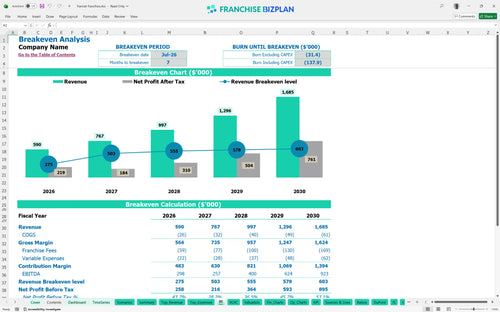
The unit reaches profitability in July 2026, just seven months after launching. This is driven by a strong year-one EBITDA of $298,000, which accounts for your 10% royalty fees and the $17,450 monthly fixed cost base before commissions scale.
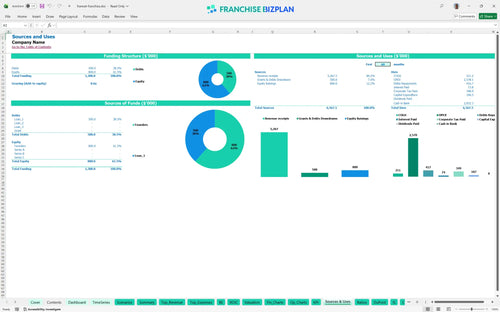
You will need $106,500 for the initial build-out and fees, plus significant working capital to reach the $1,120,000 minimum cash point. This budget covers everything from the $25,000 franchise fee to $15,000 in computer equipment and $25,000 for office improvements.
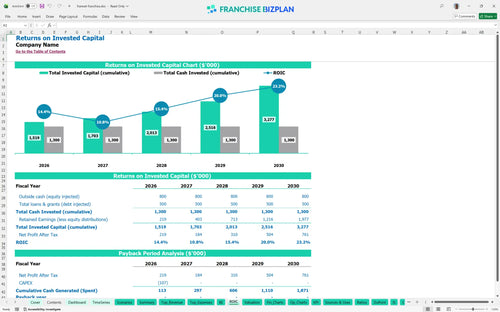
Investors can expect an Internal Rate of Return (IRR) of 16.01% and a Return on Equity (ROE) of 2.47. While the unit generates strong EBITDA, the total payback period extends after year five due to the high initial cash buffer required for this specific consultancy model.
The monthly break-even point is reached in month seven, provided you hit your initial placement commission targets. The biggest driver for break-even is the $5,500 monthly rent and the $260,000 annual payroll for your initial five-person team.
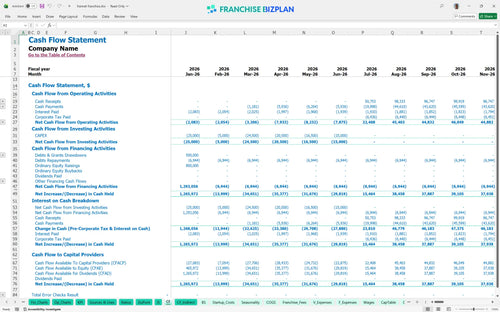
The model shows a minimum cash requirement of $1,120,000 in June 2026, which is your lowest point. You need a substantial runway to cover the gap between your January startup and the July breakeven date when commissions start flowing.
In a high-growth scenario, year-five EBITDA can reach $923,000 as revenue scales to $1.68 million. Low scenarios defintely pressure the 16.01% IRR if placement commissions lag by even 10%, as fixed costs like the $75,000 Lead Consultant salary remain constant.
This franchise business plan Excel template is built for flexibility, allowing you to tweak every assumption from placement commissions to local rent. You can easily adjust the pre-filled formulas to mirror your specific territory or market conditions, making it a versatile franchise investment analysis tool for any stage of your due diligence.

Planning for the long haul is easier with this franchise profitability projection model that tracks your growth from year one through year five. It maps out a scaling revenue path starting at $590,000 and climbing toward $1,685,000, giving you a clear view of how your consultancy hub evolves over time.

Managing your obligations is simple with built-in logic for estimating royalty fees and operating costs for franchise units. The model accounts for the $25,000 initial fee and a steady 10% royalty rate, so you always know exactly how much of your gross revenue stays in your pocket after brand contributions.

This franchise startup cost spreadsheet breaks down your initial $106,500 capital expenditure, from leasehold improvements to software setup. By identifying your fixed costs like the $5,500 monthly rent, the model calculates the exact volume of placement commissions needed to hit your break-even point by month seven.

We have integrated franchise unit economics and benchmarks to help you sanity-check your projections against industry standards. Whether you are looking at labor costs for your Lead Consultant or occupancy expenses in a high-end district, these benchmarks ensure your model remains grounded in reality.


Simply purchase and download the financial model template, then access it instantly using Microsoft Excel or Google Sheets. No installation or technical expertise required-just open and start working.

Enter your business-specific numbers, including revenue projections, costs, and investment details. The pre-built formulas will automatically calculate financial insights, saving you time and effort.

Leverage the investor-ready format to confidently showcase your financial projections to banks, franchise representatives, or investors. Impress stakeholders with clear, data-driven insights and professional reports.

Leverage the investor-ready format to confidently present your projections to banks, franchise representatives, or investors.