
All-in-one Dashboard
Core inputs and core outputs


This Excel template for restaurant franchise financial forecasting provides a complete roadmap for launching and scaling a pizza delivery business.
Core inputs and core outputs
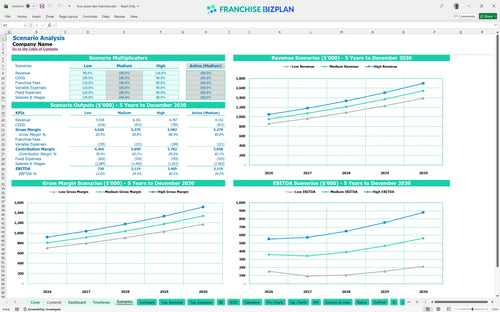
Three scenario analysis
Presentation ready
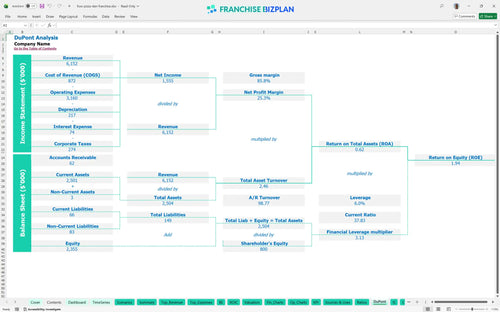
DuPont analysis
Researched revenue assumptions
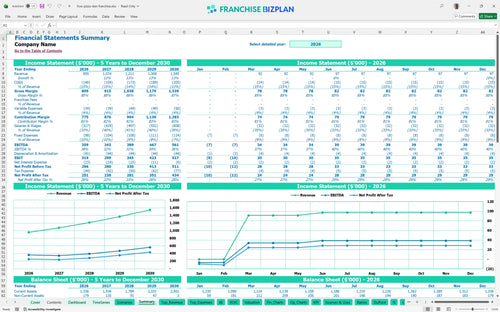
Lender-friendly financial outputs
Revenue stream detailed view
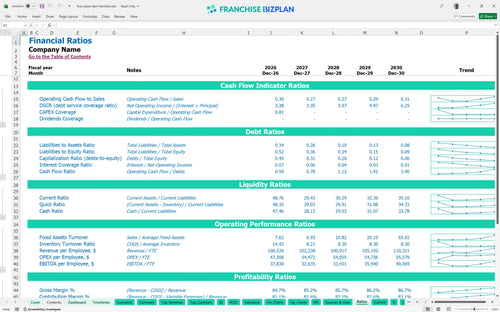
Performance metrics benchmark
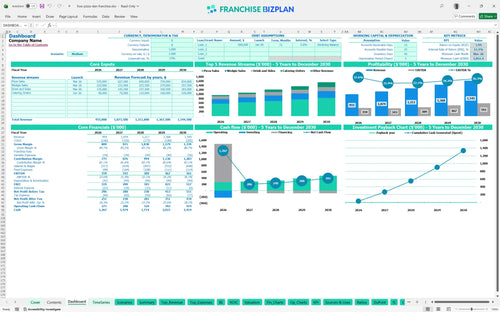
We built this pizza franchise financial model using detailed research to ensure your projections are grounded in reality. Key assumptions like the $955,000 year-one revenue and $359,000 EBITDA are pre-populated and ready for you to customize for your specific location.
The unit hits profitability immediately in Year 1 with an EBITDA of $359,000. Net profit grows steadily as food costs drop from 13.5% to 11.5% over five years, significantly boosting the franchise unit profitability analysis.
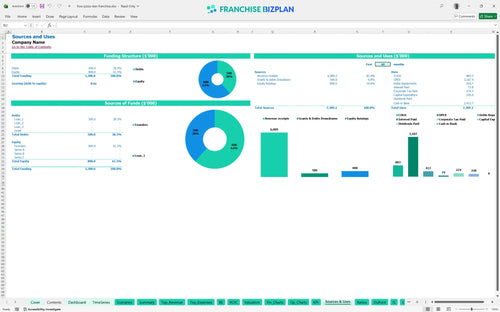
You need $220,000 to launch, covering everything from the $15,000 franchise fee to $90,000 in leasehold improvements. This startup budget template for food and beverage franchise ensures no hidden costs surprise you during the build-out.
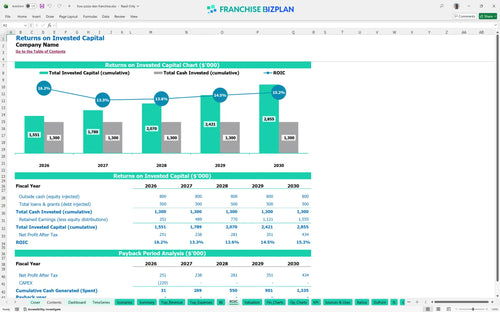
The pizza franchise investment return calculator shows an IRR of 11.09% and a ROE of 1.94. Payback is expected after Year 5, so you must focus on consistent execution and local market density to drive value.
The unit reaches break-even in March 2026, just three months after launch. This fast start depends on hitting $380,000 in Year 1 pizza sales while managing $5,500 in monthly rent and other QSR operating expenses.
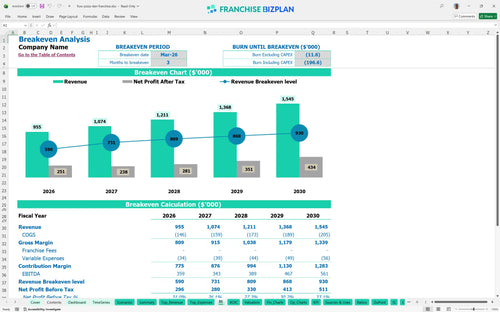
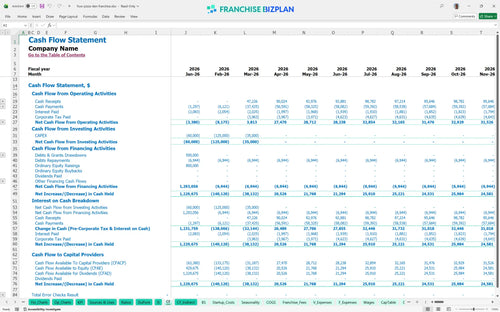
The lowest cash point occurs in March 2026 at $1,051,000 during the initial ramp-up. Planning operational costs for a new pizza outlet requires keeping a buffer, especially since the model assumes a 3-month ramp-up to break-even.
High scenarios boost Year 1 revenue above $955,000, accelerating the 11.09% IRR. Low scenarios might push the March 2026 break-even date further out if catering orders don't hit the $40,000 Year 1 target, stressing the cash runway.
This pizza franchise financial model is built in Excel with editable assumptions to match your specific territory. You can adjust the pizza shop financial projection based on local labor rates and rent to see how they impact your bottom line.

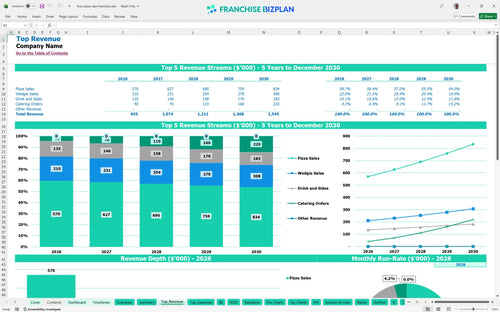
Long-term planning is vital for any pizza restaurant profit margin analysis tool. This model tracks revenue growth from $955,000 in Year 1 to over $1.5 million by Year 5, allowing you to visualize your multi-unit potential.

Estimating franchise royalty and marketing fees is straightforward, even though this specific data set shows 0% for ongoing fees. The model still captures the initial $15,000 franchise fee to ensure an accurate ROI calculation for franchises.

Knowing how to calculate startup costs for a pizza franchise helps you manage the $220,000 total initial investment. The break-even analysis for independent pizza shop or franchise unit shows exactly when monthly revenue covers all QSR operating expenses.

Use this food cost percentage calculator to compare your 13.5% initial food cost against industry standards. It helps you sanity-check your pizza restaurant profit margin analysis tool assumptions against real-world pizza shop performance.


Simply purchase and download the financial model template, then access it instantly using Microsoft Excel or Google Sheets. No installation or technical expertise required-just open and start working.

Enter your business-specific numbers, including revenue projections, costs, and investment details. The pre-built formulas will automatically calculate financial insights, saving you time and effort.

Leverage the investor-ready format to confidently showcase your financial projections to banks, franchise representatives, or investors. Impress stakeholders with clear, data-driven insights and professional reports.

Leverage the investor-ready format to confidently present your projections to banks, franchise representatives, or investors.