
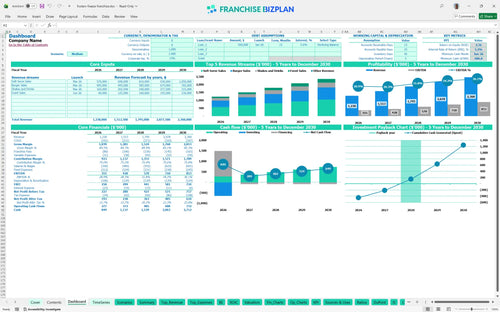
All-in-one Dashboard
Core inputs and core outputs


This comprehensive Excel template provides a detailed startup cost spreadsheet for food service franchise units, covering five years of P&L, cash flow, and ROI analysis.
Core inputs and core outputs
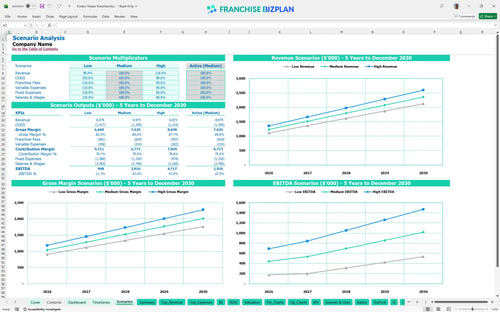
Three scenario analysis
Presentation ready
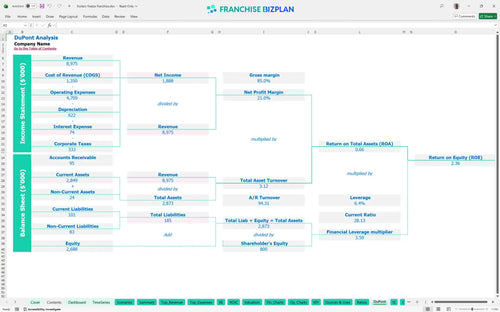
DuPont analysis
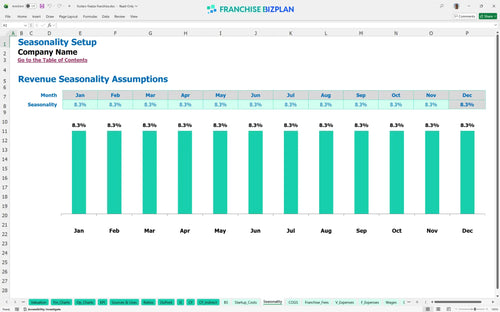
Researched revenue assumptions
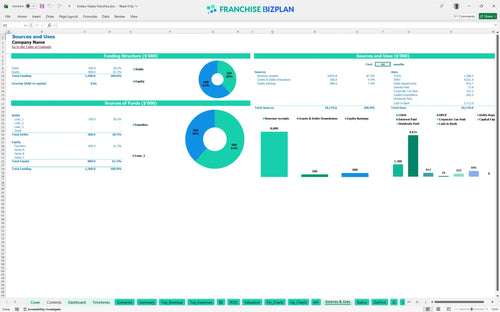
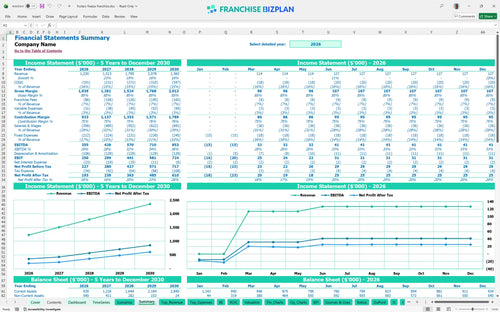
Lender-friendly financial outputs
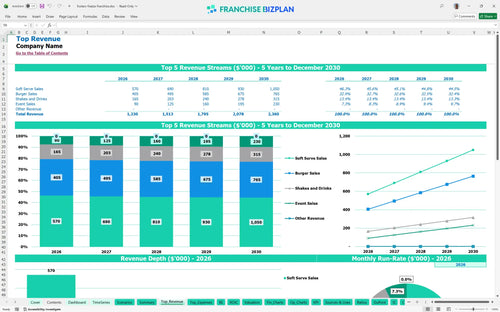
Revenue stream detailed view
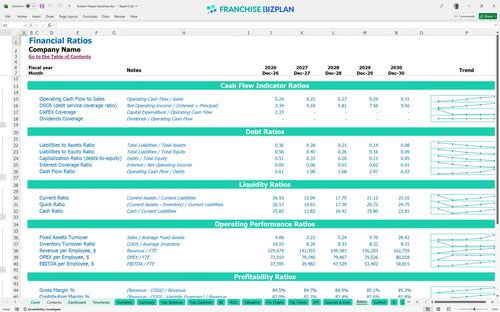
Performance metrics benchmark
We built this franchise unit financial model for QSR businesses using detailed research to ensure your pro forma is grounded in reality. The model comes pre-populated with researched data, such as the $1.23M Year 1 revenue target and $645,000 in total CAPEX, all of which are fully editable. This tool helps you evaluate franchise profitability before investing by mapping out every dollar from the initial $45,000 fee to the final Year 5 EBITDA of $853,000.
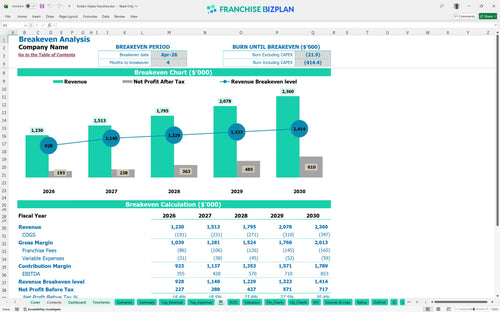
The unit is projected to reach profitability very quickly, hitting its break-even point in April 2026, just four months after launch. With Year 1 EBITDA estimated at $355,000, the model accounts for the 4% royalty and 3% marketing fees while maintaining a healthy margin. This rapid ramp-up is defintely dependent on hitting your Soft Serve and Burger sales targets from day one.
You will need $645,000 in total capital for the initial build-out and launch of this unit in the US. This investment covers the $45,000 franchise fee, $250,000 for leasehold improvements, and $120,000 for essential kitchen equipment like grills and freezers. The model also includes a $687,000 minimum cash buffer to ensure you can handle early operational swings without stress.
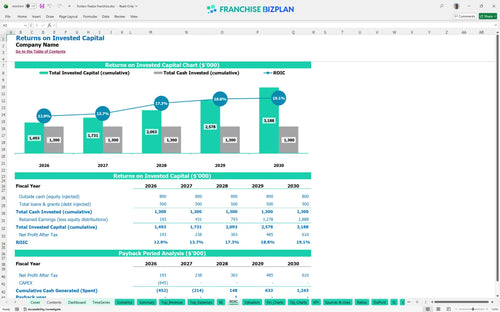
A franchisee can expect an Internal Rate of Return (IRR) of 5.19% and a Return on Equity (ROE) of 2.36% based on these projections. The payback period is approximately 3 years, which is standard for a high-performing QSR unit with $1.2M+ in annual volume. As revenue climbs toward $2.36M by Year 5, your store-level margins and cash-on-cash returns improve significantly.
The monthly break-even point occurs in month 4, requiring enough revenue to cover $13,000 in rent and roughly $20,000 in monthly management salaries. The biggest driver for reaching this point is volume; specifically, the model relies on $380,000 in soft serve sales in the first year. If your throughput at the drive-thru lags, your timeline to cover fixed costs will stretch.
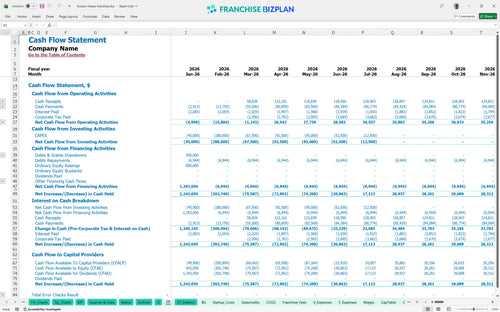
The lowest cash point is projected for June 2026 at $687,000, which suggests you have a very strong runway if you start with the recommended capital. You should maintain at least 3-4 months of operating expenses in reserve to handle the timing gaps between payroll and merchant processing deposits. This buffer protects you against slower-than-expected ramp-up in your 'Friday Night Freeze' community events.
In a High scenario where revenue exceeds the $1.23M Year 1 baseline by 10%, your payback period could drop below 30 months. Conversely, a Low scenario with higher food costs or lower traffic would delay your break-even date and increase the peak cash need. The model shows that even small shifts in the 7% total franchise fee burden can significantly impact your Year 1 net margin.
This franchise financial model is built in Excel to give you total control over your projections. It features pre-filled formulas and editable assumptions, making it simple to adjust for your specific territory, local rent prices, and labor market. Whether you are a multi-unit operator or a first-time buyer, this franchise business plan template allows you to swap out variables to see how different operating scenarios impact your bottom line.

Success in the QSR space requires looking beyond the grand opening. This tool provides detailed 5-year revenue, cost, and cash flow projections to help you plan for long-term growth and equipment replacement cycles. By using this restaurant P&L template, you can track how scaling from $1.23M in Year 1 to $2.36M in Year 5 changes your unit economic modeling and overall tax strategy.

Operating a brand-name unit involves specific financial obligations that can squeeze margins if not tracked correctly. The model automatically calculates the 4% royalty fee and 3% marketing fund contribution based on your gross sales. This ensures you understand the real economics of the business after the franchisor takes their cut, allowing for precise operating expense forecasting and better cash management.

Knowing your total 'all-in' cost is the first step to avoiding a liquidity crunch. This franchise startup cost calculator aggregates everything from the $45,000 initial fee to the $250,000 leasehold improvements. By calculating the break-even point for a new franchise location, you can identify the exact daily traffic and average ticket needed to cover your $13,000 monthly rent and fixed overhead.

This food service franchise profitability model includes built-in benchmarks to help you sanity-check your numbers against industry standards. You can compare your projected food costs-starting at 12.5% in Year 1-against typical QSR ranges to ensure your waste management and portion controls are on point. It is a vital financial forecasting tool for new franchise owners who need to verify their assumptions before signing a lease.


Simply purchase and download the financial model template, then access it instantly using Microsoft Excel or Google Sheets. No installation or technical expertise required-just open and start working.

Enter your business-specific numbers, including revenue projections, costs, and investment details. The pre-built formulas will automatically calculate financial insights, saving you time and effort.

Leverage the investor-ready format to confidently showcase your financial projections to banks, franchise representatives, or investors. Impress stakeholders with clear, data-driven insights and professional reports.

Leverage the investor-ready format to confidently present your projections to banks, franchise representatives, or investors.