


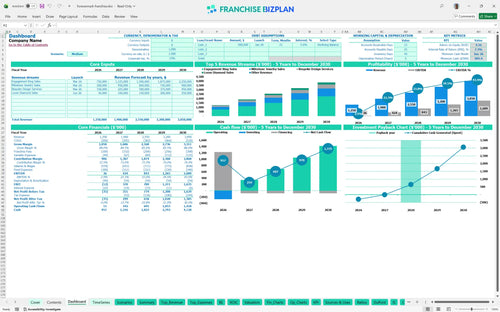
All-in-one Dashboard
Core inputs and core outputs



This pre-written financial model for retail franchise owners includes everything from capital expenditure planning to detailed revenue forecasting for high-end boutique environments.
Core inputs and core outputs
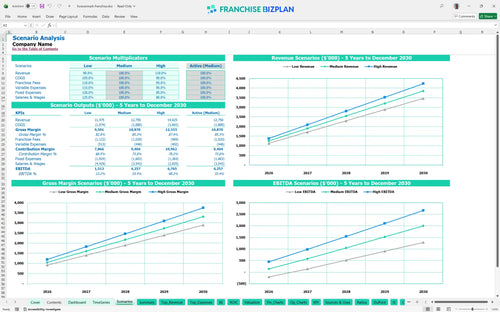
Three scenario analysis
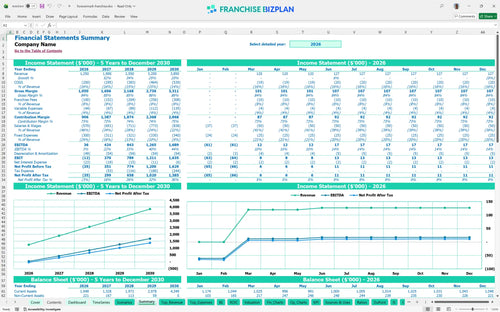
Presentation ready
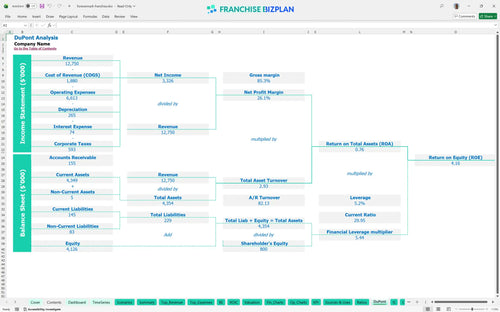
DuPont analysis
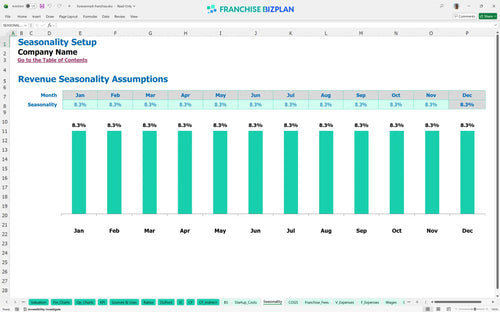
Researched revenue assumptions
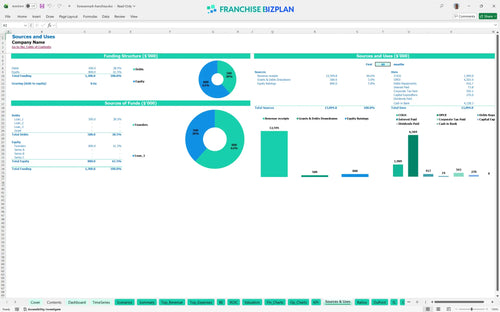
Lender-friendly financial outputs
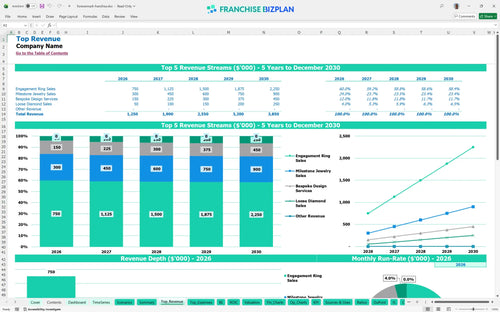
Revenue stream detailed view
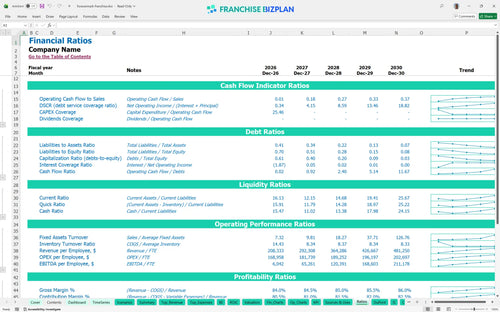
Performance metrics benchmark
We developed this franchise unit business plan template using deep research into luxury retail units and high-end jewelry economics. All assumptions, including the $130,000 manager salary and the $1.25M year-one revenue target, are pre-populated but fully editable to fit your specific location and local demand.
The unit hits positive EBITDA almost immediately, but true bottom-line strength shows up in year two. After covering $18,000 in monthly rent and 8% in total brand fees, EBITDA grows from $36,000 in year one to $424,000 in year two as sales volume scales toward $1.9M.
You will need approximately $270,000 for the core startup budget, plus a significant cash buffer for inventory and ramp-up. This includes the $100,000 franchise fee and $50,000 for leasehold improvements to meet luxury brand standards in a prime location like Scottsdale.
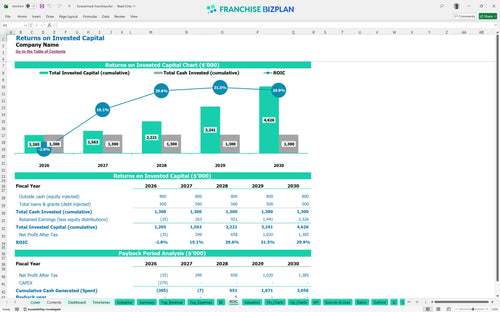
Investors can expect an Internal Rate of Return (IRR) of 7.32% and a full payback on initial capital within 3 years. To be fair, the return on equity (ROE) sits at 4.16%, which is steady for a high-CAPEX luxury retail jewelry store profit analysis.
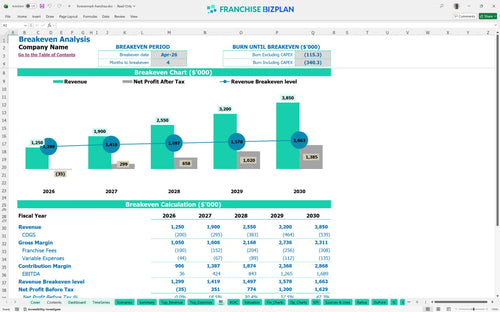
The unit reaches its break-even date in April 2026, just four months after the initial launch. This rapid break-even depends heavily on hitting the $500,000 engagement ring sales target in the first year while managing the $18,000 monthly rent burden.
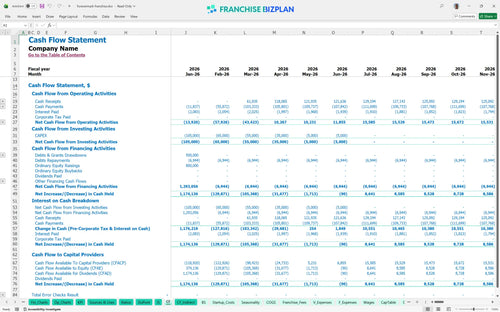
The lowest cash point occurs in June 2026, with a minimum cash balance of $905,000. This suggests you need a deep capital pool to manage inventory procurement and high fixed costs before the year-two revenue surge defintely stabilizes the bank account.
A high-performance scenario where revenue hits 120% of plan accelerates the payback period to under 2.5 years and significantly boosts the year-one $36,000 EBITDA. Conversely, a low-revenue case makes the $421,000 annual payroll for specialized staff very difficult to maintain without additional capital.
Finance: update unit break-even and payback model by Friday
This franchise financial projection spreadsheet provides a complete Excel-based framework for evaluating a luxury retail location. You can adjust every formula and assumption to match your specific territory, from local labor rates to Scottsdale-level rent, ensuring the model reflects your actual market conditions.

Success in high-end retail requires a long-term view of the cash cycle and inventory turns. This model delivers a detailed 5-year franchise P&L statement and cash flow forecasting for retail, mapping your growth from a $1.25M year-one start to a mature $3.85M operation by year five.

We built this tool to handle the specific financial burdens of a luxury brand, including the $100,000 initial fee and ongoing 6% royalty payments. By automating the 2% marketing fund calculation, the model ensures your ROI calculation for franchises accounts for every dollar owed to the brand before you see a profit.

Knowing how to calculate startup costs for a jewelry franchise is the difference between a successful launch and a mid-year cash crunch. This template aggregates leasehold improvements, display cases, and initial inventory to show you exactly when your monthly sales will finally cover your $18,000 monthly rent and high-end staffing costs.

This retail jewelry store profit analysis uses real-world data to help you sanity-check your overhead. If your gemologist and store manager salaries exceed 20% of revenue, the model flags it, allowing you to compare your store-level margins against typical luxury retail performance standards.


Simply purchase and download the financial model template, then access it instantly using Microsoft Excel or Google Sheets. No installation or technical expertise required-just open and start working.

Enter your business-specific numbers, including revenue projections, costs, and investment details. The pre-built formulas will automatically calculate financial insights, saving you time and effort.

Leverage the investor-ready format to confidently showcase your financial projections to banks, franchise representatives, or investors. Impress stakeholders with clear, data-driven insights and professional reports.

Leverage the investor-ready format to confidently present your projections to banks, franchise representatives, or investors.