
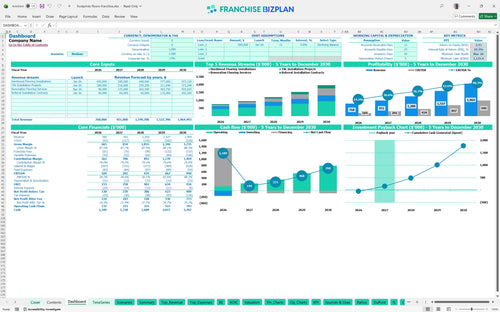
All-in-one Dashboard
Core inputs and core outputs


This financial model for home service franchise units provides a complete roadmap from an initial $68,000 fee to a $949,000 year-five EBITDA.
Core inputs and core outputs
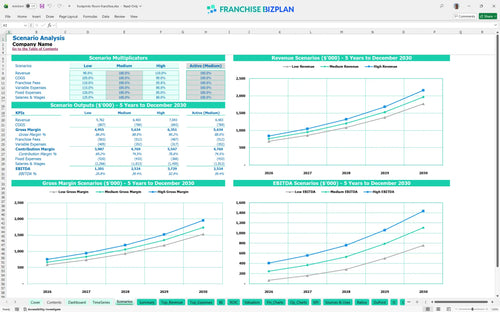
Three scenario analysis
Presentation ready
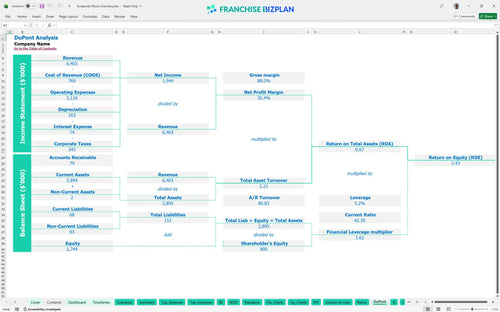
DuPont analysis
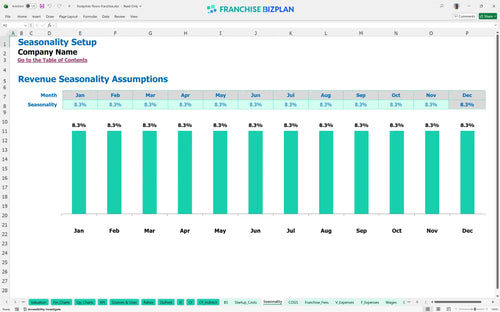
Researched revenue assumptions
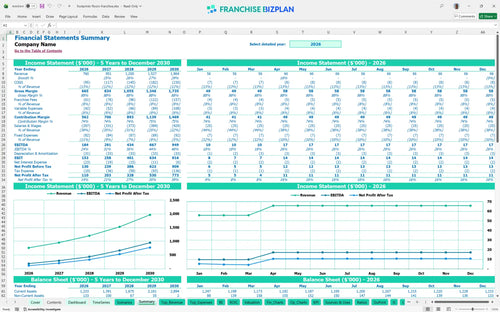
Lender-friendly financial outputs
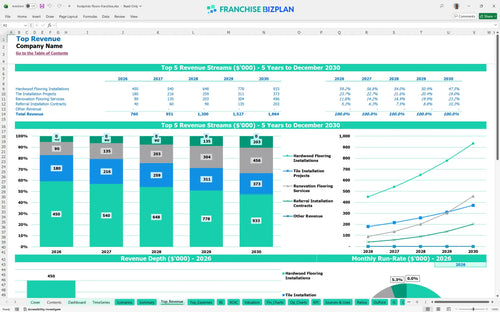
Revenue stream detailed view
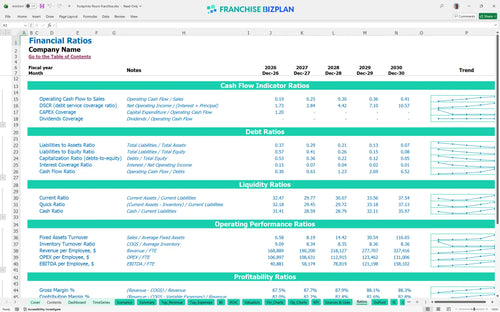
Performance metrics benchmark
We built this franchise unit financial model using our own research into mobile flooring service operations. Key assumptions like the $300,000 year-one hardwood revenue and $1,800 monthly van lease are pre-populated and fully editable to match your specific market territory.
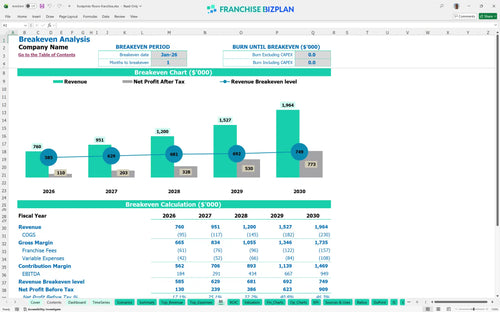
Based on our research, this model shows a very fast path to black ink, with a breakeven date of January 2026. By year two, you are looking at an EBITDA of $291,000 after accounting for the 6.0% royalty and 2.0% marketing fees.
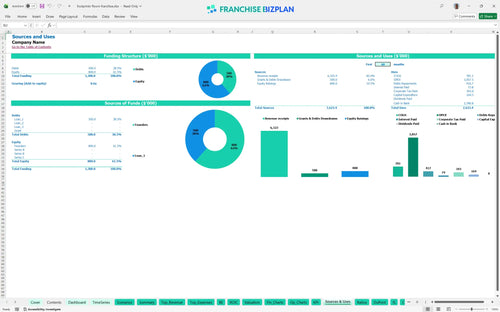
To launch this unit, you will need to cover a $68,000 franchise fee and roughly $164,480 in total startup costs including equipment and marketing. The model accounts for a $38,000 van purchase and $12,000 in initial materials to ensure you have the runway to reach your first $300,000 in hardwood sales.
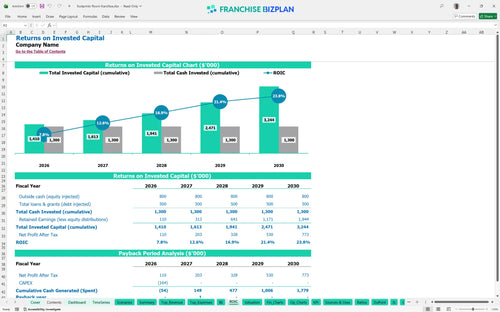
The franchise investment return on investment template shows an IRR of 10.34% and a 2.43 ROE. With a 2-year payback period, the model demonstrates how the low-overhead, showroom-free model converts revenue into owner equity quickly.
This unit hits break-even in just one month because the fixed costs are kept low by avoiding a physical showroom. The primary driver is your sales volume in hardwood and tile, as the 6.0% royalty and 4.2% subcontractor labor are variable costs.
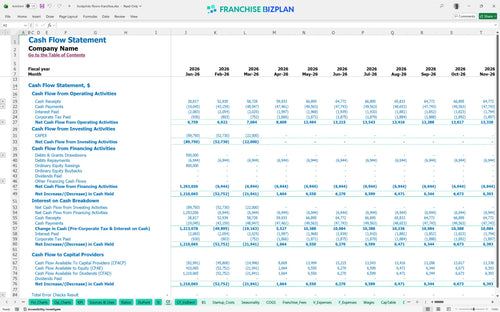
The minimum cash point hits $1,135,000 in March 2026, reflecting the timing of initial inventory and equipment buys. While the model shows a fast start, having a buffer for the first 90 days is vital to manage the gap between installation and final payment.
Analyzing franchise unit revenue and profit margins across scenarios shows that even a 10% dip in sales still yields a positive EBITDA due to the variable labor model. In the high case, hitting $1.9 million in year five significantly accelerates your ROI calculation and business valuation model.
This franchise unit financial model template is fully customizable in Excel, allowing you to tweak every driver from installation volume to material costs. It comes with pre-filled formulas and editable assumptions, so you can defintely map out your specific territory in North Scottsdale or Paradise Valley without starting from scratch.

Planning for a single unit requires a deep look at how revenue scales from $760,000 in year one to over $1.9 million by year five. This small business financial projection tool provides a detailed 5-year outlook on cash flow and profit, ensuring your capital expenditure planning aligns with long-term profitability analysis.

The model tracks the real cost of the brand, including the initial $68,000 franchise fee and ongoing 6.0% royalty payments. By factoring in the 2.0% marketing fund contribution, you get a clear view of the franchise unit economics and how these obligations impact your store-level margin.

Use this franchise startup cost analysis to estimate your total initial investment, including equipment like the $38,000 delivery van and $18,500 in tools. Calculating break-even point for new franchise units is simple when you can see exactly how many hardwood or tile jobs are needed to cover your fixed monthly overhead.

We have integrated industry-specific benchmarks so you can compare your 10.5% material cost or 4.2% subcontractor labor against typical home service standards. This franchise investment feasibility study helps you sanity-check your operating expense forecast to ensure your margins stay competitive in the local market.


Simply purchase and download the financial model template, then access it instantly using Microsoft Excel or Google Sheets. No installation or technical expertise required-just open and start working.

Enter your business-specific numbers, including revenue projections, costs, and investment details. The pre-built formulas will automatically calculate financial insights, saving you time and effort.

Leverage the investor-ready format to confidently showcase your financial projections to banks, franchise representatives, or investors. Impress stakeholders with clear, data-driven insights and professional reports.

Leverage the investor-ready format to confidently present your projections to banks, franchise representatives, or investors.